Fed Rate and Bitcoin: How Federal Funds Policy Moves Crypto Markets
Markets want a cut. Powell has not delivered one. Bitcoin sits at roughly $77,000 in late May 2026, about $50,000 below its October 2025 all-time high near $126,000. Neither the bull nor the bear case explains that gap on its own. The fed rate does, once you stop treating it as a switch and start treating it as a slow weight on every other input. This piece walks the relationship through where it is mechanical, where it is psychological, and where the spot Bitcoin ETF era simply rewrote it.
Where the Federal Funds Rate Stands Today
As of the April 29, 2026 FOMC meeting, the federal funds rate target range is 3.50 to 3.75 percent. That is unchanged from December 2025 and represents the Committee's third consecutive hold of 2026. The fed rate, fed fund rates, and "Fed funds rate" all refer to this same benchmark short-term borrowing cost — the floor from which mortgage rates, the prime rate, and corporate lending derive. The current hold reflects a Federal Reserve weighing sticky inflation against a slowing labour market. The vote split was 8-4, the largest number of dissents on a Federal Reserve monetary policy decision since October 1992, with three dissenters favoring an immediate cut and one favoring a hike. The meeting was Jerome Powell's final press conference as chair. Kevin Warsh has been nominated to replace him later in the year.
From Zero to 5.50% and Back: The Fed Rate Path That Reshaped Crypto
To understand how Fed policy has shaped this crypto cycle, it helps to walk the rate path from one end to the other.
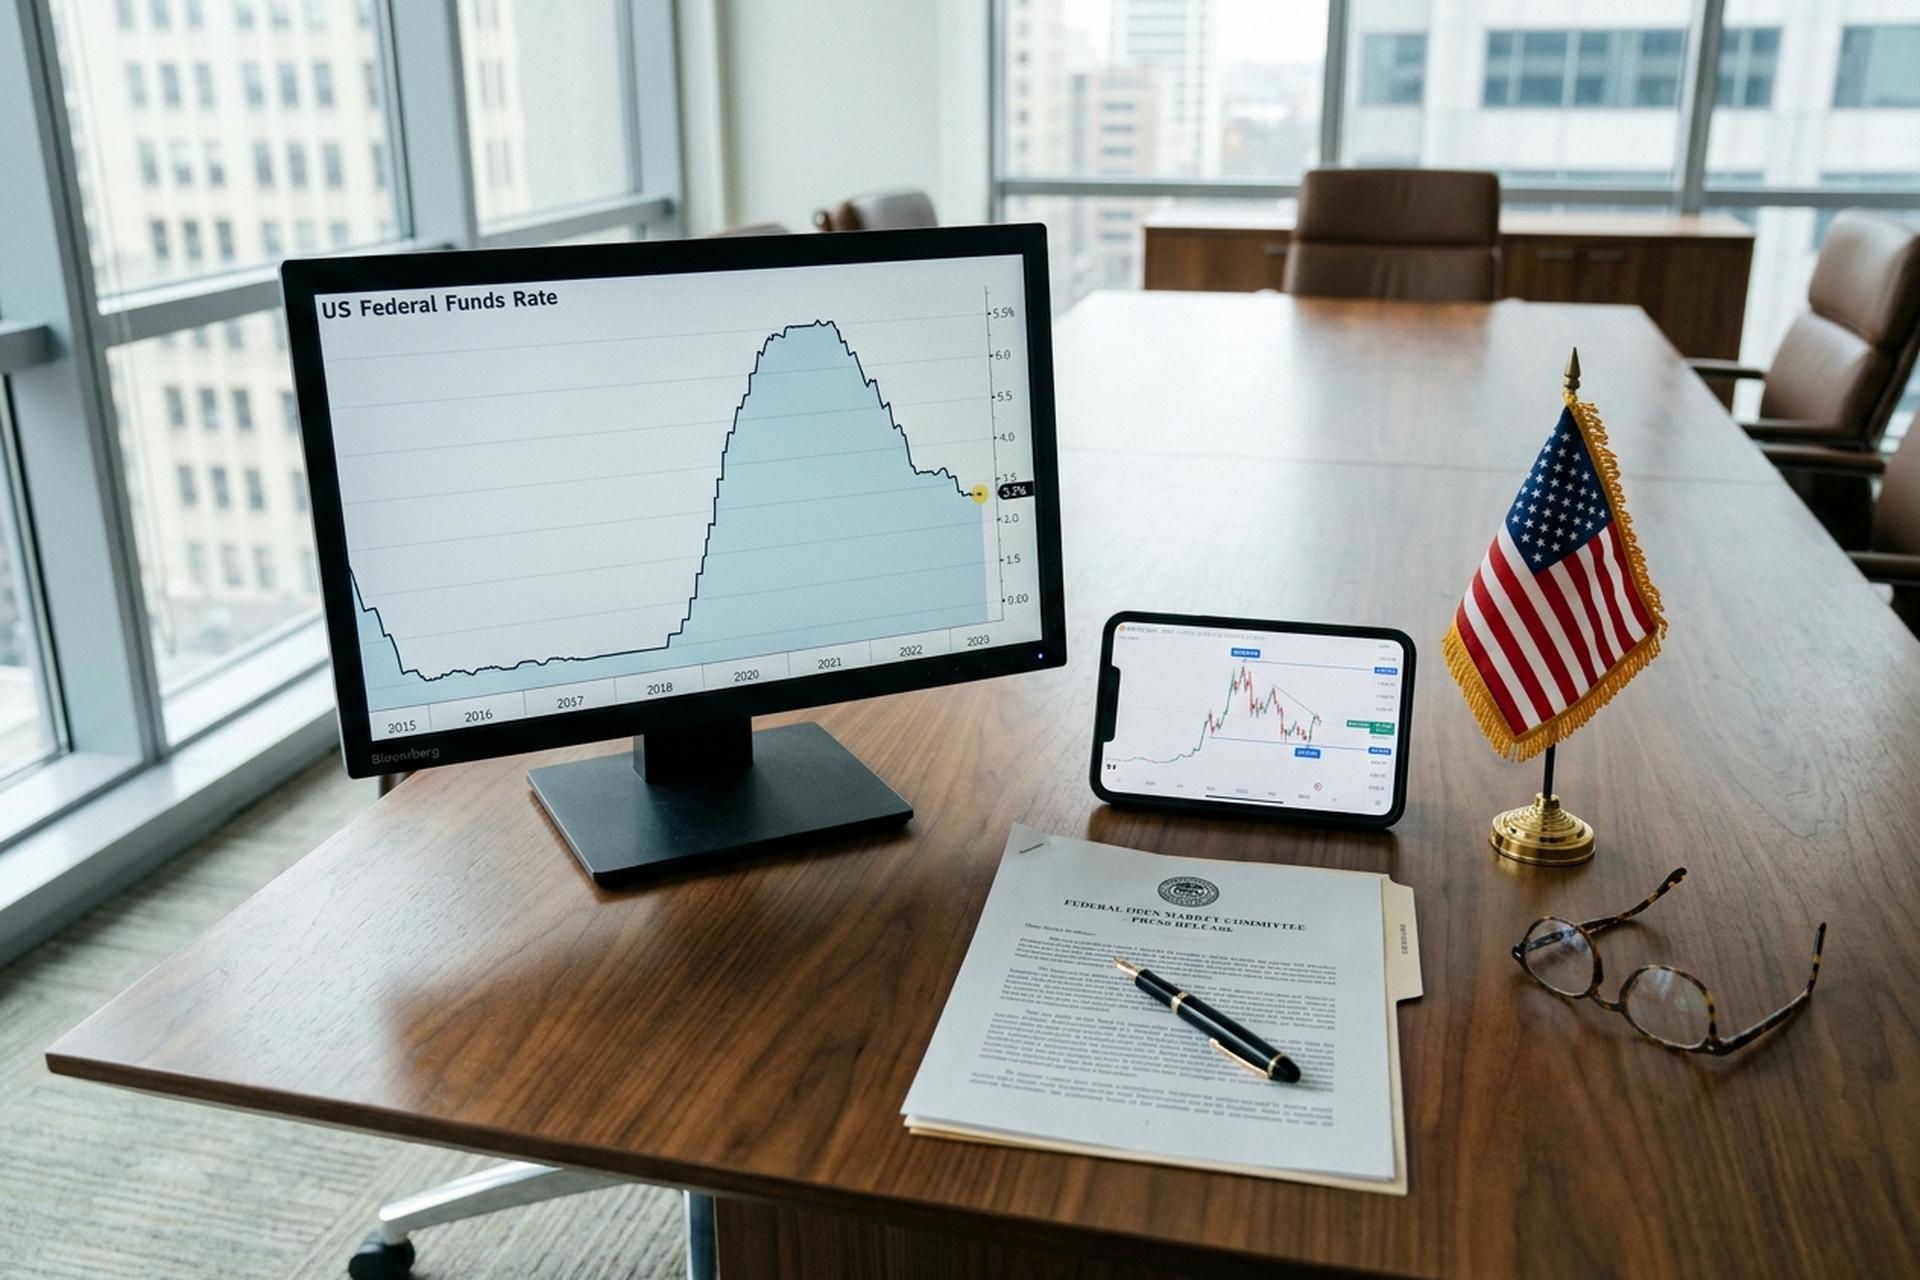
March 2020. The FOMC moved fast. Two emergency cuts in twelve days. Fifty basis points on March 3. Another hundred on March 15. The federal funds target range landed at 0 to 0.25 percent and stayed there for two years. Bitcoin had crashed to $3,800 on March 13 as global markets seized. By year-end it was near $29,000. By November 2021 it had set what was then an all-time high around $69,000. The ZIRP regime, paired with unlimited quantitative easing, was the cleanest test possible of the old "loose money lifts risk assets" thesis. Bitcoin obliged.
The tightening that followed was the fastest in four decades. The first hike came on March 16, 2022. Eleven hikes followed over sixteen months. Five hundred and twenty-five basis points of tightening. The cycle peaked at 5.25 to 5.50 percent on July 26, 2023. Bitcoin's response was brutal. Down to $15,480 in November 2022, the day after FTX filed. A grinding recovery into a $29,000-$30,000 band as rates peaked. The Fed then held the peak rate for fourteen months, the longest hold of any cycle since the early 2000s, while Bitcoin clawed back into the $40,000s ahead of the spot ETF approval.
September 18, 2024 was the inflection point. The Fed cut by 50 basis points to 4.75-5.00 percent. Three more cuts followed in 2024 (-100 bps total). Three more came in 2025 (-75 bps), bringing the target range to 3.50-3.75 percent by December. Bitcoin crossed $100,000 for the first time on December 5, 2024 at $103,679. The cycle high arrived in October 2025 above $125,000 before the retrace that brought it down toward $77,000.
| Date | FOMC action | Target range | BTC at the time |
|---|---|---|---|
| Mar 15, 2020 | Emergency cut (−100 bps) | 0–0.25% | ~$5,000 (low $3,800 Mar 13) |
| Nov 10, 2021 | Held at 0–0.25% since Mar 2020 | 0–0.25% | $69,000 (cycle ATH) |
| Mar 16, 2022 | First hike (+25 bps) | 0.25–0.50% | ~$38,000–$41,000 |
| Nov 2, 2022 | Hike (+75 bps); FTX collapses 9 days later | 3.75–4.00% | ~$16,500 (lows $15,480) |
| Mar 22, 2023 | Hike (+25 bps), 10 days after SVB | 4.75–5.00% | ~$26,400 (+32.9% week) |
| Jul 26, 2023 | Final hike (+25 bps); 14-month hold begins | 5.25–5.50% | ~$29,000 |
| Jan 11, 2024 | Hold; spot BTC ETFs approved same day | 5.25–5.50% | ~$46,000–$47,000 |
| Sep 18, 2024 | First cut (−50 bps) | 4.75–5.00% | Brief $61,000 |
| Dec 5, 2024 | Held; "BTC like gold" Powell quote | 4.50–4.75% | $103,679 ($100K milestone) |
| Oct 29, 2025 | Cut (−25 bps); 2 dissents | 3.75–4.00% | ~$125,835 (cycle ATH region) |
| Apr 29, 2026 | Hold; 8-4 vote (most dissents since Oct 1992) | 3.50–3.75% | ~$78,000 |
What stands out in that table is not that low rates lift crypto and high rates crush it; that read is too coarse and breaks down at the SVB rally and the September 2024 reaction. What stands out is the regime. Long stretches at the zero bound created the conditions for the 2020-2021 rally. The sixteen-month sprint up to 5.50 percent broke leverage and exposed FTX and Three Arrows. The fourteen-month hold gave institutional buyers time to build into the ETF launch.
How Fed Policy Actually Hits Crypto
Four channels. Different timescales. They often pull against each other within the same week, which is why short-term reactions look so noisy.
Start with what really moves: the effective federal funds rate, the volume-weighted average at which depository institutions actually lend reserve balances overnight in the federal funds market. The target range is what the FOMC publishes after each FOMC meeting. The effective rate is what trades on any given business day. The Federal Reserve uses the interest on reserve balances (IORB rate) and the overnight reverse repurchase agreement facility as the two main tools for keeping the effective rate inside the target range.
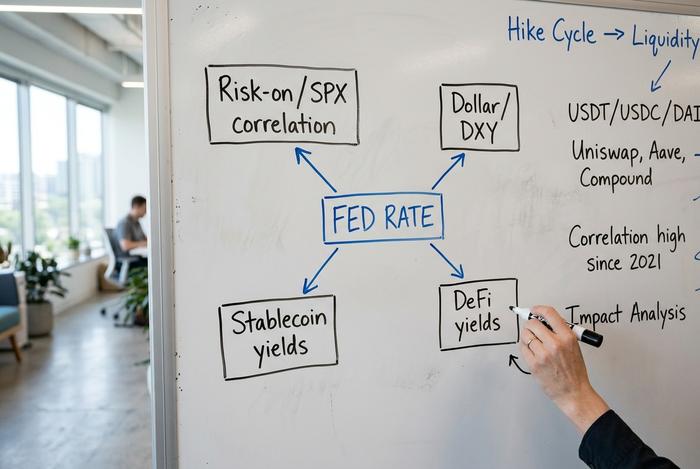
Channel one is risk-on, risk-off equity correlation. Bitcoin behaves like a high-beta tech stock when rate expectations are stable. It behaves like a macro asset when they are shifting. Its 30-day rolling correlation with the S&P 500 hit 0.88 in early January 2025, briefly flipped to roughly −0.30 in late 2025 during the post-cut sell-off, and sits near 0.74 in March 2026. A swing of that size in twelve months is the channel itself.
Channel two is the dollar. The Bitcoin-DXY correlation has lived between −0.4 and −0.8 over the past five years, with a Q1 2024 print of −0.65. When the Federal Reserve tightens faster than other central banks, the dollar index climbs. When the dollar index peaked at 114 in the fourth quarter of 2022, Bitcoin was sitting at its cycle low.
Channel three is the one I find people underrate: stablecoin yield economics. Tether holds roughly $135 billion in US Treasuries against a $176 billion market cap. Every 50 basis points the Fed cuts removes about $600 million from Tether's annual interest income, and a proportional hit lands on Circle and the smaller fiat-backed issuers. Stablecoin issuers as a group are now the seventh-largest buyer of US government debt. That makes the transmission belt sovereign-scale.
Channel four is DeFi yields competing for the same dollar deposits. When the federal funds target range peaked at 5.25 to 5.50 percent, Maker's DAI Savings Rate climbed to 8 percent to keep stablecoins onshore inside the protocol. A peer-reviewed 2026 paper in the Journal of Financial Stability traced a T+3 pass-through lag from FOMC decisions to USDC and USDT lending rates, consistent across both. As the fed rate compresses toward 3.5 percent, DeFi yields fall with it, and capital goes hunting for risk again inside the protocol stack.
The single cleanest read on how these channels aggregate comes from Binance Research's 2026 study. Before spot ETF approval, Bitcoin's correlation with the Global Easing Breadth Index (a 41-economy measure of central-bank stance) was a mild +0.21. By early 2026, it had flipped to −0.778. That is not decoupling. It is institutional money front-running the Fed by six to twelve months: by the time the cut prints, the position is already on.
Three Episodes That Break the Simple Story
"Fed cuts, Bitcoin pumps" fails often enough to be useless as a trading rule. The rate is a background condition, not a trigger. What matters in the moment is which other force happens to be loudest.
Three episodes from the last three years are worth holding in mind.
The Silicon Valley Bank collapse in March 2023 came mid-tightening. By the simple framing, Bitcoin should have fallen. Instead it rallied 32.9 percent in a week, from $19,726 to $26,400. The banking-stress thesis returned overnight: people wanted assets that did not sit on the failing bank's balance sheet.
September 18, 2024 was the first cut of the cycle. Fifty basis points, bigger than consensus. Bitcoin spiked to $61,000, then sold off for days. Arthur Hayes had spent the prior week warning that the unwind of the yen carry trade would override the rate news. He was right.
Then the October and November 2025 cuts. Both 25 basis points, both delivered on schedule. Bitcoin still fell roughly a quarter over the following weeks. The reason was ETF outflows: $6.4 billion drained from US spot Bitcoin funds between November 2025 and February 2026, swamping the rate-cut tailwind.
| Date | Fed action | Expected BTC move | Actual BTC move | Dominant override |
|---|---|---|---|---|
| Mar 2023 (SVB) | Hiking | Down (risk-off) | +32.9% in 1 week | Banking-stress safe-haven thesis |
| Sep 2024 (first cut) | −50 bps | Up (risk-on) | Brief +1.2% then flat | Yen carry-trade concern |
| Oct-Nov 2025 (cuts) | −50 bps cumulative | Up | −25% over weeks | ETF outflows $6.4B |
Why the Stablecoin Sector Is the Fed's New Direct Transmission Belt
Stablecoins are where Fed policy hits crypto hardest. Not Bitcoin. The market cap of the stablecoin sector went from about $200 billion in January 2025 to roughly $300-$320 billion by early 2026. Tether sits at 58-60 percent of that. Circle is the closest competitor. Together the sector processed about $33 trillion in transaction volume in 2025, up 83 percent year on year. And it is now tied to the federal funds rate at sovereign scale, because the issuers hold their reserves in Treasuries. Tether alone posted $13 billion in profit for 2024 on the interest income from those balances.
Watch what happens when the fed rate falls. Issuer yield income compresses mechanically. Issuance keeps growing anyway, because the dollar's interest-bearing alternatives lose their edge and stablecoins start looking attractive as plain payment rails again. Standard Chartered's February 2026 note said it bluntly: the US Treasury may need to boost T-bill issuance just to absorb stablecoin demand if the sector grows toward the $2 trillion mark. That projection assumes a stable fed rate. An aggressive cutting cycle would slow issuance growth. A hike would speed it back up.
Spot Bitcoin ETF Flows: The 2024-2026 Pattern
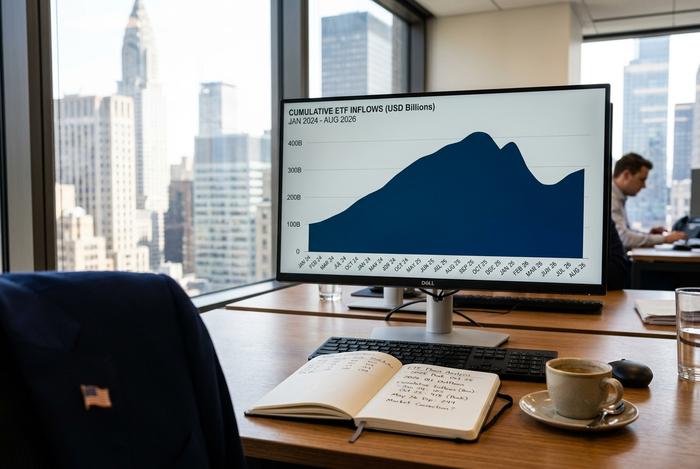
The spot Bitcoin ETFs launched on January 11, 2024. Since then, ETF flows have become a cleaner real-time read on Fed expectations than the BTC spot price itself. Day one volume was $4.6 billion. By the September 2024 first cut, cumulative net inflows had reached $18.9 billion. By the end of Q1 2026, $56 billion. BlackRock's IBIT alone held about $54 billion in assets as of March 2026, controlling 49 percent of the US spot BTC ETF market. The peak was $67 billion at the late-2025 high, when Bitcoin was trading near $88,000.
The outflow phase tells the same story in reverse. Between November 2025 and February 2026, the US spot Bitcoin ETF complex lost $6.4 billion. The market was pricing in fewer 2026 cuts than the September 2025 dot plot had implied. Institutional allocators were re-rating their fed rate outlook. Fewer expected cuts meant a higher effective cost of holding a non-yielding asset, and that outflow, not the rate moves themselves, is the explanation I keep coming back to for the slide from the October 2025 ATH down to where BTC sits today.
| Window | Cumulative ETF inflow | BTC price |
|---|---|---|
| Jan 11, 2024 (day 1) | $4.6B volume | ~$46,000–$47,000 |
| Sep 2024 (first cut) | $18.9B net | ~$61,000 brief |
| Late 2025 (ATH) | Peak (~$60B+) | ~$125,835 |
| Q1 2026 | $56B net (after $6.4B outflows Nov-Feb) | ~$77,000–$88,000 range |
What CME FedWatch and the Dot Plot Say for 2H 2026
The March 2026 dot plot put the FOMC's median for end-2026 at 3.40 percent. That implies one more 25 basis point cut from the current band. As of May 2026, CME FedWatch is pricing less than a 10 percent probability of any cut during the year. Market and Fed are aligned for the first time since 2022. Which means crypto is facing a low-volatility rate-expectation regime for the rest of the year, unless Kevin Warsh signals something different when he takes over.
Two things would change that. One is the inflation rate trajectory. Any re-acceleration above 3 percent and short-term interest rates lock in place through year-end. The other is Warsh's commentary on the neutral fed rate, which can shift market pricing without a single actual rate change happening. Either direction matters. A hawkish pivot hits Bitcoin through the dollar and equity channels. A dovish surprise sets the stablecoin sector up for an issuance squeeze.
What This Means for Crypto Investors and Payment Rails
The practical reads are short. Yield-bearing stablecoins lose income as the fed rate falls but gain payment utility. For merchants accepting USDC or USDT, that is a tailwind, not a headwind. ETF flows are now the leading indicator. A sustained outflow regime predicts spot weakness regardless of where the rate prints. Crypto-payment infrastructure is consolidating in this regime. Coinbase Commerce exited non-US and non-Singapore markets on March 31, 2026, pushing roughly 8,000 merchants toward alternatives such as Plisio, NOWPayments, and CoinGate. The pull toward stablecoin-native gateways is most pronounced exactly when fiat yields are compressing.


