Bollinger Bands: A Technical Analysis Tool for Crypto Traders

Every trader is really asking one question before they click buy or sell: is this price high or low right now? Not high compared to last year — high compared to where it has been trading lately. Bollinger Bands exist to answer exactly that. They are a technical analysis tool that wraps a moving average in a band of recent volatility, so you can see at a glance whether price is stretched or sitting in its comfort zone. John Bollinger built them in the early 1980s, and the defaults he chose then are still the defaults most charts use today. This guide explains how Bollinger Bands work, how to read them, and why crypto's wild volatility changes the way you should use them.
What Bollinger Bands are and how they work
Three lines hug the price on your chart. Before you trust any of them, it pays to know what each one is actually doing.
The three bands
Start in the middle. The middle band is just a moving average of recent price, nothing exotic. The upper band and lower band sit above and below it, and the gap between that upper and lower band is the part that matters. It is not fixed. It breathes. Markets get jumpy and the bands fling apart; things go quiet and they squeeze back in. That breathing is the signal. A flat support line cannot do it, and that is the whole reason a Bollinger band beats a static level.
The math: a moving average and two standard deviations
Here is the recipe, and it has barely changed in 40 years. Take a 20-period simple moving average, the average close of the last 20 candles. Then draw the outer lines two standard deviations above and below it. Standard deviation sounds intimidating. It is just a number for how scattered recent prices have been, so two standard deviations is shorthand for "unusually far from normal." When the market heats up, that number grows and the bands widen by themselves. You touch nothing. The math does the reacting.
Why most price stays inside the bands
In theory, if price wandered like a tidy bell curve, about 95 percent of it would stay inside those two standard deviations. That is the mental model. Tag the upper band and price is stretched toward the top of its recent range; tag the lower band and it is down near the floor. Bollinger Bands ship with two companion readings that sharpen this picture: %B tells you exactly where price sits between the bands, and BandWidth tells you how wide they are.
| Component | What it shows | Formula or default |
|---|---|---|
| Middle band | Trend baseline | 20-period simple moving average |
| Upper band | Top of recent range | Middle + two standard deviations |
| Lower band | Bottom of recent range | Middle − two standard deviations |
| %B | Where price sits in the bands | (Price − Lower) / (Upper − Lower) |
| BandWidth | How wide the bands are | (Upper − Lower) / Middle × 100 |
Keep one caveat in mind: crypto does not follow a tidy bell curve, which is why that 95 percent figure is shakier here than the textbook suggests.
How to read the bands: squeeze, expansion, and walking the bands
Once you see Bollinger Bands as a volatility gauge first and a price gauge second, they start to tell a story.
The squeeze: a period of low volatility
When the bands pinch together, the market is in a period of low volatility. Traders call this the squeeze, and it is the single most watched Bollinger pattern. Quiet markets do not stay quiet forever, so a tight squeeze often comes before a sharp price move. The catch is that the squeeze tells you a move is coming, not which way it will go. A breakout can resolve up or down, and reading the direction wrong is how people get hurt trading the squeeze.
When the bands expand
A real breakout shows up as the bands suddenly expanding. Volatility spikes, the standard deviation jumps, and the envelope flares open. This usually confirms that a price movement has started rather than predicting one. The width of the band, read directly off the BandWidth line, puts a number on it: a very high reading marks an expansion that is probably closer to its end than its start. After the bands expand hard, volatility tends to fade again, which pulls them back toward each other and sets up the next cycle.
Walking the bands in a strong trend
Beginners often misread a price that clings to the upper band as "overbought, time to sell." In a strong trend it can mean the opposite. During a powerful uptrend, price will ride the upper band for a long stretch, a behavior called walking the bands. Each tag of the band is the trend flexing, not exhausting itself. The same happens along the lower band in a hard downtrend. This is why the bands alone never give you a clean signal.
Bollinger Bands trading strategies
Most uses boil down to three plays, and each suits a different market. Run them blindly and they will lose — match them to the regime and they earn their keep.
The first is mean reversion, sometimes called the bounce. In a sideways, range-bound market, price tends to fall back from the upper band toward the middle and rebound from the lower band. Traders fade the extremes, buying near the lower band and trimming near the upper one, looking for entry and exit points at the edges of the range. The second is the squeeze breakout: wait for a tight squeeze, then trade in the direction of the breakout once the bands expand, with a stop on the other side so a false start does not cost much. The third is trend-riding, where you use the middle band as a trailing guide and hold while price walks the band, exiting only when price closes back through the middle.
None of these are complete trading strategies on their own. Smart use means pairing the bands with a second, non-correlated tool. Many traders add RSI to judge momentum or volume to confirm a breakout, then size positions with real risk management rather than betting the farm on one touch. Used by themselves, the bands throw off more noise than dependable trading signals, and the cleanest setups are the ones where two independent tools point the same way. Bollinger Bands shape your trading decisions; they do not make them for you.
Bollinger Bands in crypto: volatility and fat tails
This is where the generic guides quietly let crypto traders down. They were written for stocks. Crypto is a different animal.
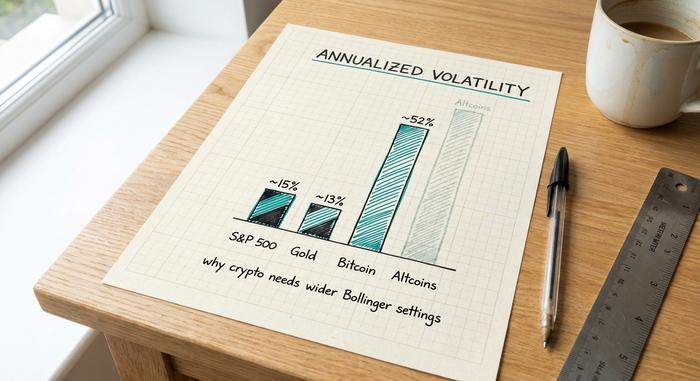
Look at the raw numbers. Bitcoin's realized volatility has run somewhere around 50 to 55 percent annualized through 2024 and 2025, three to four times that of a major equity index, based on The Block's annualized volatility data. On an average day it swings about 1.7 percent, and plenty of altcoins move several times harder than that. More price volatility means the standard-deviation engine runs hot, the bands sit wider, and price keeps tagging them.
Then there are the tails. Crypto has fat ones. The giant moves that "shouldn't happen" show up far more often than a bell curve says they should, and that one quirk changes how Bollinger Bands behave compared to traditional markets. Price closes outside the bands more often than the textbook 5 percent, and a lot of those breaks just keep going instead of snapping back. Naive mean-reversion dies right there.
| Market | Typical annualized volatility | Common Bollinger setting |
|---|---|---|
| S&P 500 | ~12-20% | 20-period SMA, 2 standard deviations |
| Gold | ~12-15% | 20, 2 |
| Bitcoin | ~50-55% (2024-25) | 20, 2 up to 2.5-3.0 |
| Small-cap altcoins | Higher still | Shorter lookback or wider bands |
So traders adapt. Many widen the outer bands to 2.5 or even 3 standard deviations, or shorten the lookback, so the indicator stops screaming "extreme" every time crypto does something that is normal for crypto. These are habits, not rules handed down from on high. They come from one stubborn fact: a setting tuned for a 15-percent-volatility stock index is just too tight for an asset that swings three times as hard.
The squeeze and why timing matters in crypto
For crypto specifically, the squeeze is the most useful thing Bollinger Bands offer. Crypto cycles between long dead stretches and violent expansions, and BandWidth pressing to a multi-month low is a clean way to flag that a quiet phase is overdue to break.
It is still a setup, not a trigger. Timing matters because the same strategy can win or lose depending on the regime. One backtest of a Bollinger mean-reversion system on BTC/USDT from 2023 to 2025 (an unreviewed SSRN preprint, so treat it as directional) reported a profit factor near 1.62 in ranging markets, when the trend strength reading ADX was below 20, but roughly −0.74 in trending markets, when ADX climbed above 30. In plain terms: fading the bands worked while Bitcoin chopped sideways and actively bled money once a strong trend took hold. It was the same indicator on the same coin; only the regime changed, and the regime decided the outcome. The squeeze tells you energy is building. You still need a second read on whether to fade the next move or follow it, because BandWidth alone never points up or down.

Limitations and Bollinger's own rules
Here is the part most guides skip. John Bollinger wrote a set of 22 rules for his indicator, and several of them are warnings. Rule 6 states plainly that a tag of the upper band is not in and of itself a sell signal, and a tag of the lower band is not a buy signal. The bands are built to surface setups where the odds may be in your favor, not to issue a stream of buy and sell commands.
That matters because a Bollinger band, used alone, generates a steady drip of false signals, especially in trending or fat-tailed markets. The fix is not a better setting; it is confirmation. Read the band tag as context, then check a separate technical indicator, the volume, or the broader trend before you act. Treat the bands as one witness — never as judge and jury.
Default settings and how to start
If you are just beginning, leave the defaults alone: a 20-period simple moving average with bands at two standard deviations. Add %B and BandWidth as small sub-panels so you can read position and width as numbers instead of eyeballing them. Bollinger Bands come standard on essentially every charting platform, from TradingView to your exchange's built-in tools. Watch how they behave on the coins you actually trade for a few weeks, then consider widening the bands for crypto's larger swings.
Why Bollinger Bands still matter
Cut through the jargon and Bollinger Bands do one quietly useful job. They show you whether price is stretched against its own recent behavior, and whether volatility is coiling or letting go. That makes them a great context tool and a lousy standalone signal. The money gets lost in the gap between those two, and crypto only widens the gap, because the swings are so much bigger here. So read Bollinger Bands as a question, never an answer. Pair them with something that confirms direction. Do that, and they earn their permanent spot on your chart.


