Fibonacci Retracement: Levels, Math, and Reality
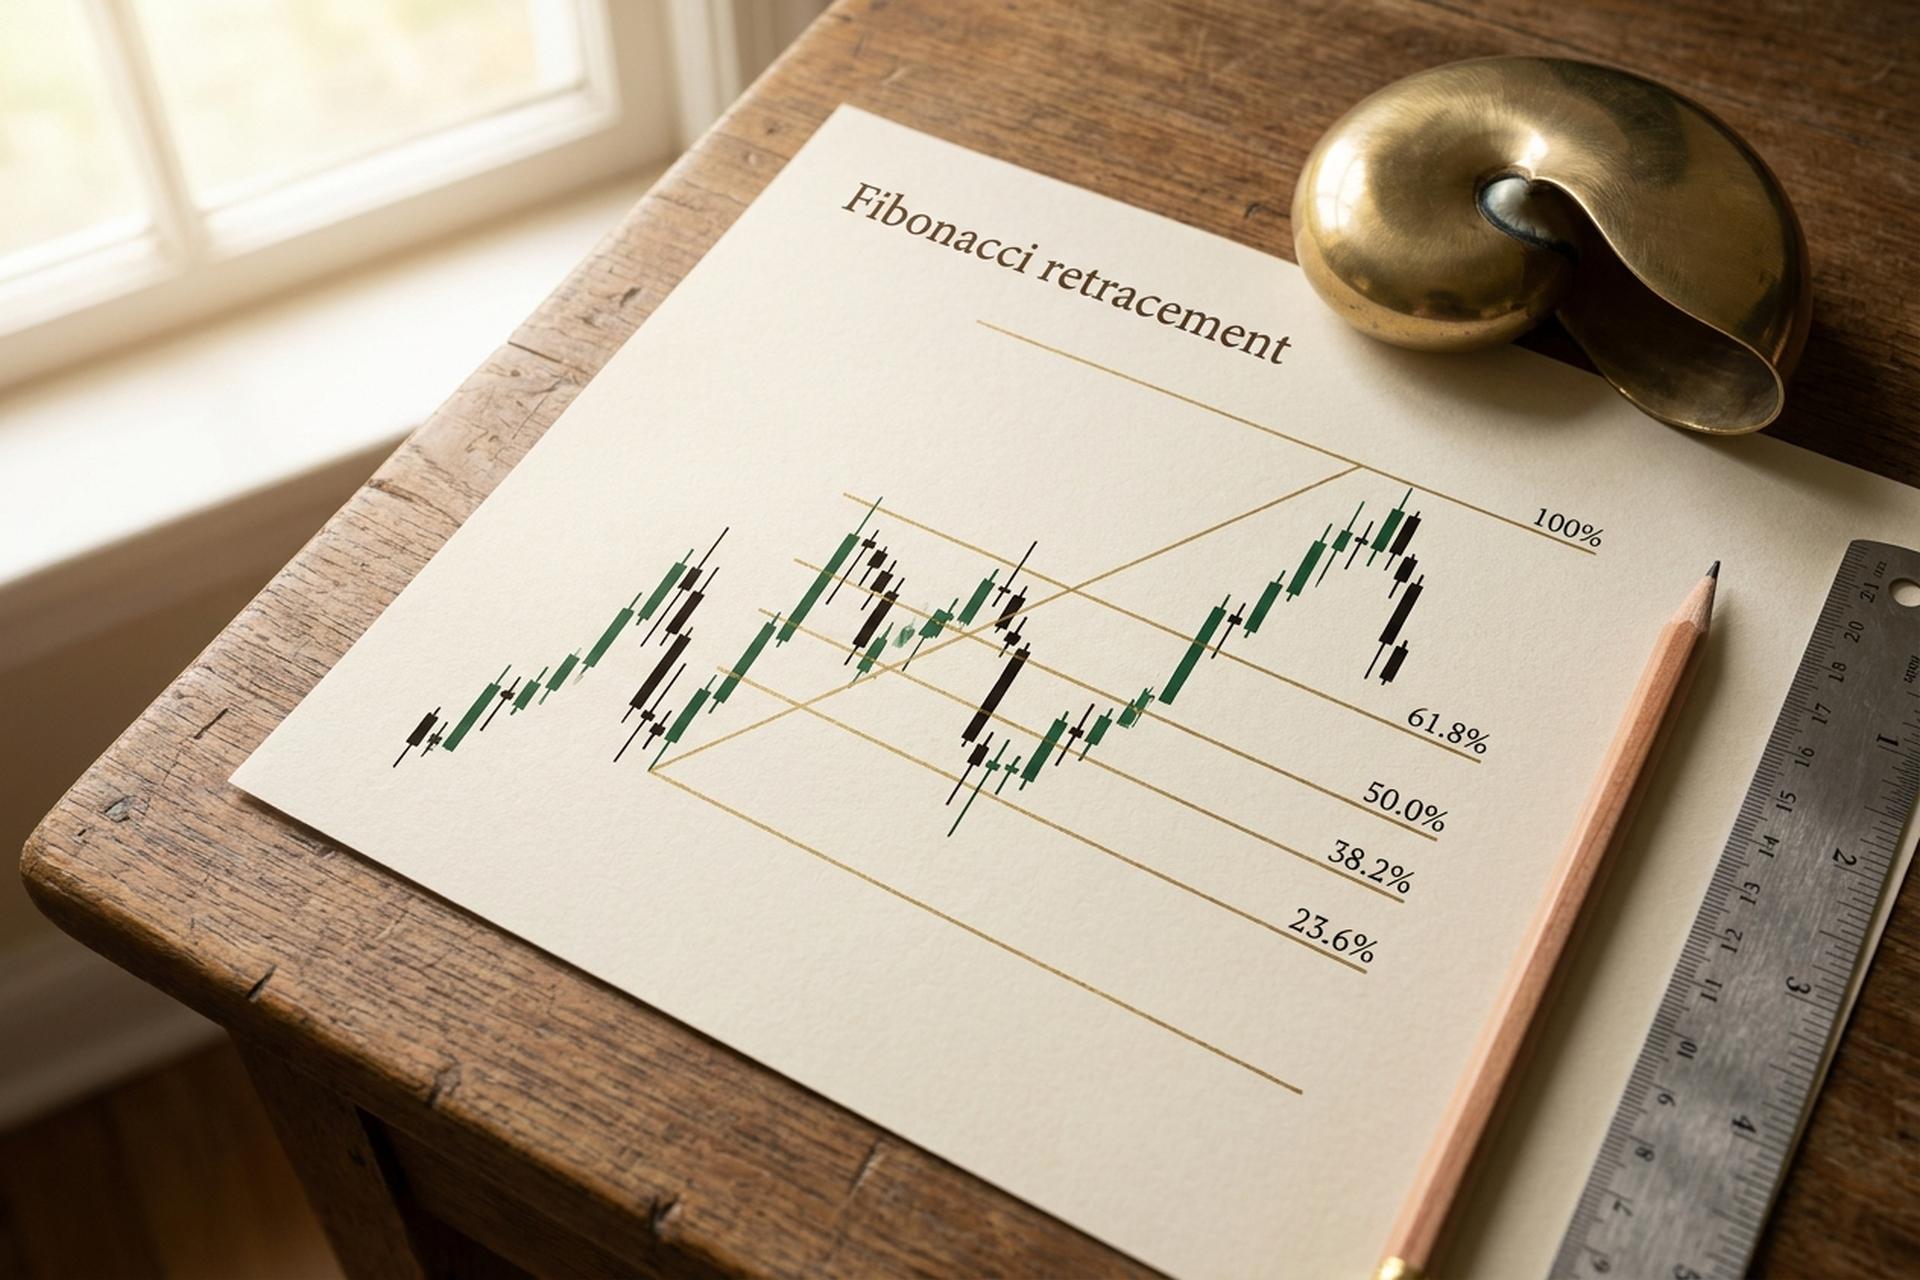
The price levels that millions of traders watch every day trace back to a 13th-century puzzle about how fast rabbits breed. Stranger still, one of the most-watched levels of all, the 50% line, is not a Fibonacci number at all. A Fibonacci retracement takes a recent price move and marks horizontal Fibonacci retracement levels, the percentages a pullback might reach before the trend resumes. It is one of the most popular tools in technical analysis, and one of the most misunderstood.
This guide does three things in order. First, it shows where the levels actually come from, with the math correct rather than hand-waved. Then it explains how to draw and use a Fibonacci retracement on a chart, including in crypto. Finally, it asks the question most guides avoid: does any of this actually work?
What Fibonacci retracement is and where it comes from
To see what a Fibonacci retracement actually measures, look at the numbers behind it. They are not arbitrary. They are also not as cleanly "Fibonacci" as most explanations pretend, and that gap is the whole point of this section.
The Fibonacci sequence and the golden ratio
Start with the sequence: 0, 1, 1, 2, 3, 5, 8, 13, 21, 34, 55. Each number is the sum of the two before it. Simple enough. Leonardo of Pisa carried it into Europe in his 1202 book Liber Abaci, though he did not invent it. Indian mathematicians had it centuries earlier, Pingala and then Hemachandra around 1150, who spelled out the rule directly.
Now divide any term by the one before it. The answer keeps settling near 1.618. That is the golden ratio, phi, and its flip side is 0.618. Phi has a quirk: it equals one plus its own reciprocal, so squaring it only adds one. Walk further down the sequence and consecutive terms lock into that proportion ever more tightly. The same number turns up in sunflower seeds, snail shells, the Parthenon. That pedigree is exactly why 0.618 feels almost mystical when it lands on a price chart, deserved or not.
Where the retracement levels come from
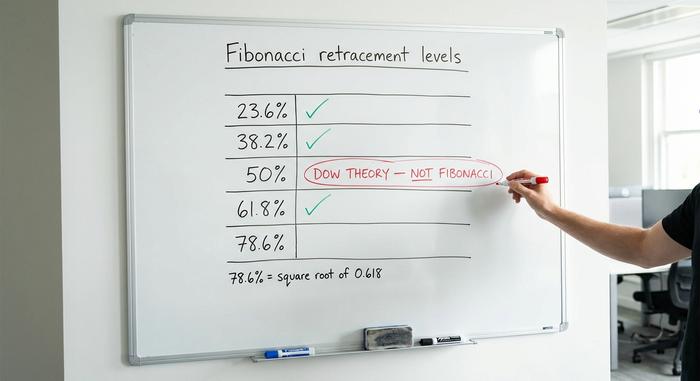
Here is the part most guides skip. The 61.8% level is that golden ratio reciprocal again, what you get dividing any term by the next. The 38.2% level comes from dividing a term by the one two places up, which also happens to equal one minus 0.618. The 23.6% level, three places up. Those three are real Fibonacci ratios. No argument.
Then it gets loose. The 78.6% level is the square root of 0.618, which is not a sequence ratio at all, just a number traders found handy. And the famous 50%? Not Fibonacci either. It comes from Dow Theory and Charles Dow's old observation that markets tend to give back about half a move. It sits on your chart out of habit, not math.
| Level | Value | Where it comes from | Truly Fibonacci? |
|---|---|---|---|
| 23.6% | 0.236 | term ÷ term three places higher | Yes |
| 38.2% | 0.382 | term ÷ term two places higher | Yes |
| 50% | 0.500 | Dow Theory halfway level | No |
| 61.8% | 0.618 | golden ratio reciprocal (1/φ) | Yes |
| 78.6% | 0.786 | square root of 0.618 | Indirect |
Retracement versus extension
Two words get mixed up constantly, so pin them down now. A retracement measures how far price pulls back inside a move, somewhere from 23.6% to 78.6%. An extension projects how far the next leg might run past the move, using levels like 161.8%. Same family of numbers — opposite jobs. Confuse them and nothing else here will land.
How to use Fibonacci retracement on a chart
The mechanics take two clicks. It is a drawing indicator built into nearly every charting platform, from TradingView downward, so the difficulty lives in the judgment rather than the software; the whole result depends on which two points you choose.
How to draw it (swing high to swing low)
In an uptrend, you anchor the retracement tool at the swing low and drag to the swing high; the horizontal lines then mark where a pullback might find support. In a downtrend, you go from the swing high to the swing low to mark resistance on a bounce. The underlying formula is simple: for an uptrend, a level sits at the high minus the size of the price movement times the percentage. The hard part is honest swing selection, because two traders looking at the same chart often pick different points and get different levels.
Entries, stops, and the golden pocket
Traders use Fibonacci retracements as zones to consider entering in the direction of the trend, not as automatic buy buttons. The 61.8% area, often stretched to a 61.8 to 65% band called the golden pocket, gets the most attention. A common approach is to wait for price to reach a level, look for a confirmation signal such as a reversal candle, then place a stop just beyond the next level down so the trade is wrong cheaply if the level fails.
A quick example makes it concrete. Say Bitcoin rallies from 50,000 to 70,000 and then starts to pull back. The 61.8% retracement sits near 57,640, since the 20,000 move times 0.618 is about 12,360, subtracted from the high. A trader who likes that zone would wait for price to stall there, look for a bounce, and set a stop somewhere below the 78.6% level near 54,280, where the idea of a continued uptrend stops making sense.
Using Fibonacci retracement in crypto
Crypto traders adopted the tool enthusiastically, partly because the markets run 24/7 and chart patterns are all many traders have to go on overnight. Drawing a retracement on Bitcoin or Ethereum works the same way as on any market. The catch is volatility: in a violent crypto move, price can blow through every level without pausing, so the tool works best combined with support and resistance levels you can already see.
Fibonacci extension levels for price targets
Retracements tell you how deep a pullback might go. They say nothing about how far the next leg runs once the trend takes off again, because by then price is in fresh ground. Extensions fill that gap. Traders lean on these Fibonacci extensions to pick where to take profit.
Three levels do most of the work. 127.2%, the square root of 1.618. Then 161.8%, the golden ratio itself, and the one most people actually watch. And 261.8% for the rare runaway move. The golden ratio keeps turning up, mirrored from the 61.8% retracement, which is no coincidence. Drawing them needs three points, not two. Mark the start of the move as A, the top as B, and the bottom of the pullback as C; the tool stacks the targets above C. Run the math on a 10,000-point move and the 161.8% target lands about 16,180 points over C. It looks absurd on the chart, right up until a strong trend gets there.
| Extension | Value | Typical use |
|---|---|---|
| 127.2% | 1.272 | first conservative target |
| 161.8% | 1.618 | primary target (golden ratio) |
| 261.8% | 2.618 | extended target in a strong trend |
Does Fibonacci retracement actually work?
This is the question the how-to guides quietly avoid, and the honest answer is that the evidence is mixed and, for the tool used alone, mostly unflattering.
A 2022 study in Expert Systems with Applications tested Fibonacci retracements automatically across the Dow, NASDAQ, and DAX. It found that the probability of price bouncing at a Fibonacci level was statistically indistinguishable from the probability of it bouncing at a random non-Fibonacci level. As a standalone rule, the levels held no special power. A separate 2022 paper in Financial Innovation found that a Fibonacci strategy did beat buy-and-hold for several energy stocks, but failed to do so for energy cryptocurrencies, where extreme volatility wrecked the signal. Other working papers report small positive results, though some have not yet been peer-reviewed.
There is a deeper objection too. The efficient-market view holds that past prices cannot predict future ones, which would make any chart-only method, Fibonacci included, useless by definition. Few working traders believe markets are perfectly efficient, but the critique is a useful corrective: if a pattern is obvious and free, its edge tends to get arbitraged away. Put together, the research says the same thing a careful trader will tell you: Fibonacci retracement is not a money printer, and anyone selling it as one is selling something. Whether it adds value depends entirely on how it is used.
The self-fulfilling prophecy and confluence
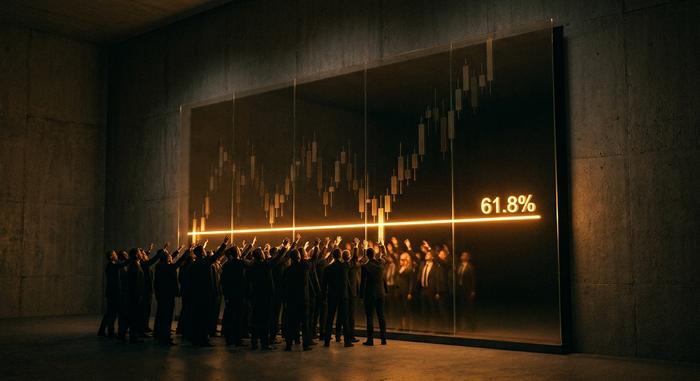
There is a better defence of the tool than "the ratios are magic." The levels can matter simply because so many people watch them. Put thousands of traders placing orders near the 61.8% Fibonacci retracement level and, sure enough, buying pressure shows up there, at least for a while. Psychologists have a name for the reflex behind it: anchoring, our habit of fixating on a reference number, documented by Amos Tversky and Daniel Kahneman back in 1974.
This is where confluence earns its keep. A level sitting on top of old support, a round number, a pivot point, or a moving average gets respected far more than one hanging in empty space. Picture the 61.8% retracement of a Bitcoin move landing a few dollars from the round 60,000 mark, right where a previous swing low sits. Any one of those signals is weak on its own. Stack all three and a lot of traders suddenly have the same reason to buy the same spot. That crowd is the whole game. The line carries no power; the agreement around it does. That mechanism is coherent, widely cited, and still not proven to be the actual cause of any price clustering, which is a fair summary of technical analysis in general.
Common mistakes when using Fibonacci retracement
Most failures using Fibonacci retracement are not the tool's fault. They come from the person holding it.
The first and worst is subjective swing selection. Because you choose the two anchor points yourself, you can nudge the levels until one of them lines up with whatever you already believed, which is analysis in reverse. The second is using the tool in isolation, treating a level as a signal rather than an alert that needs confirmation from price action. The third is over-fitting after the fact: pointing at the one level that worked and ignoring the three that did not. Add too many levels and you cover the chart so thoroughly that price is always near something, which feels like insight and is actually noise. A fourth trap is timeframe shopping, flipping between the five-minute and daily charts until you find a retracement that fits the trade you already wanted to make.
Other Fibonacci tools: arcs, fans, time zones
Fibonacci retracement is the famous one, but it has relatives. Arcs draw curved levels that mix time with price. Fans throw diagonal lines off a trendline at the same ratios. Time zones drop vertical lines at sequence intervals to guess when a move might turn, rather than where. All three are niche. Far fewer traders use them, and the evidence underneath is thinner still. Worth knowing they exist. Not worth building a strategy around.
How to use Fibonacci retracement well
Treat a Fibonacci retracement as a map of where to look, not a forecast of what happens next. It earns its place under three conditions. Its levels sit on real support and resistance. You wait for confirmation instead of front-running a line. And every trade carries a stop that makes being wrong survivable. Hit those and it becomes a sensible piece of a broader trading strategy. Treat it as a crystal ball and it will bill you for the lesson eventually. Which leaves one honest question worth sitting with. If a level only works because everyone watches it, what exactly is your edge when everyone else is watching too?