RSI Divergence: Bullish, Bearish, Hidden, and 2026 Crypto Examples
Of all the patterns a technical trader can learn, RSI divergence has one of the strangest reputations. Some traders hold it up as a near-magic reversal signal. Quants tend to dismiss it as a coin flip dressed up with chart annotations. The truth sits between those poles. RSI divergence reliably flags weakening momentum before price has reacted, but only on the right timeframes, and only when traders treat it as a warning rather than a trigger. This article explains what the Relative Strength Index is, walks through the four divergence patterns every trader should know, and tests the framework against three real market episodes from 2024 to 2026 — the Bitcoin top of October 2025, the Ethereum top of August 2025, and the strong 2024 trend where divergence shorts got steamrolled.
What is the Relative Strength Index?
The Relative Strength Index is a momentum indicator. A bounded momentum oscillator, specifically, that measures the speed and magnitude of recent price changes on a 0-to-100 scale. J. Welles Wilder Jr. introduced it in his 1978 book New Concepts in Technical Trading Systems, published the same month in Commodities magazine. The default lookback period he proposed, 14 candles, never moved. Every major charting platform still ships it as the default, from MetaTrader to TradingView.
The classic interpretation is easy enough to memorize. Above 70 is overbought. Below 30 is oversold. To use RSI well, a trader has to accept that those bands are not hard reversal lines. They are pressure gauges. Crypto markets, with their wider volatility, often widen them to 80 and 20. Why does it matter that RSI is bounded at all? Because overshoot becomes mechanically meaningful in a way that an unbounded momentum measure like MACD cannot match.
What is RSI divergence in technical analysis?
RSI divergence is the simplest pattern in technical analysis that traders consistently misuse. The definition is simple. Divergence occurs when price action and the RSI line move in opposite directions across two consecutive swing highs, or two consecutive swing lows. Price makes a higher high (or a lower low); RSI does not match.
Take a specific example. If price prints a fresh new high but the RSI peak falls short of its earlier peak, momentum is weakening underneath the move. Price still looks strong; the indicator says otherwise. The reverse holds at lows. Why does this matter? Mechanically: RSI measures the rate of recent change. If price is climbing at a slower rate than before, the oscillator records the deceleration before the price chart does.
That early warning property is why divergence anchors so many trading strategy templates. It is also why it is mis-applied so often. The pattern registers a shift in market sentiment a bar or two before the price action does — but it cannot tell you exactly when the reversal will fire. That gap is what most beginners miss.
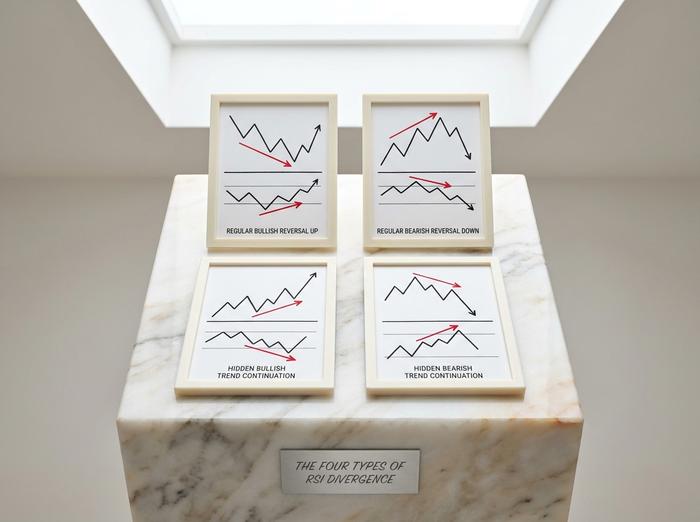
The four types of RSI divergence
Most beginner articles teach two divergence patterns, regular bullish and regular bearish, and stop there. The complete framework includes four. Two reversal patterns, two continuation patterns. The matrix below summarises them.
Regular bullish divergence. Price makes a lower low while RSI prints a higher low. The reading is that sellers are exhausted: the new low in price was achieved with less momentum than the previous one. Regular bullish divergence near an oversold RSI reading at a key support level is one of the most consistent reversal signals in technical analysis. Bitcoin's November 2022 weekly bottom near $15,500 came with exactly this pattern, after the FTX collapse pushed RSI to multi-year lows on declining downside force.
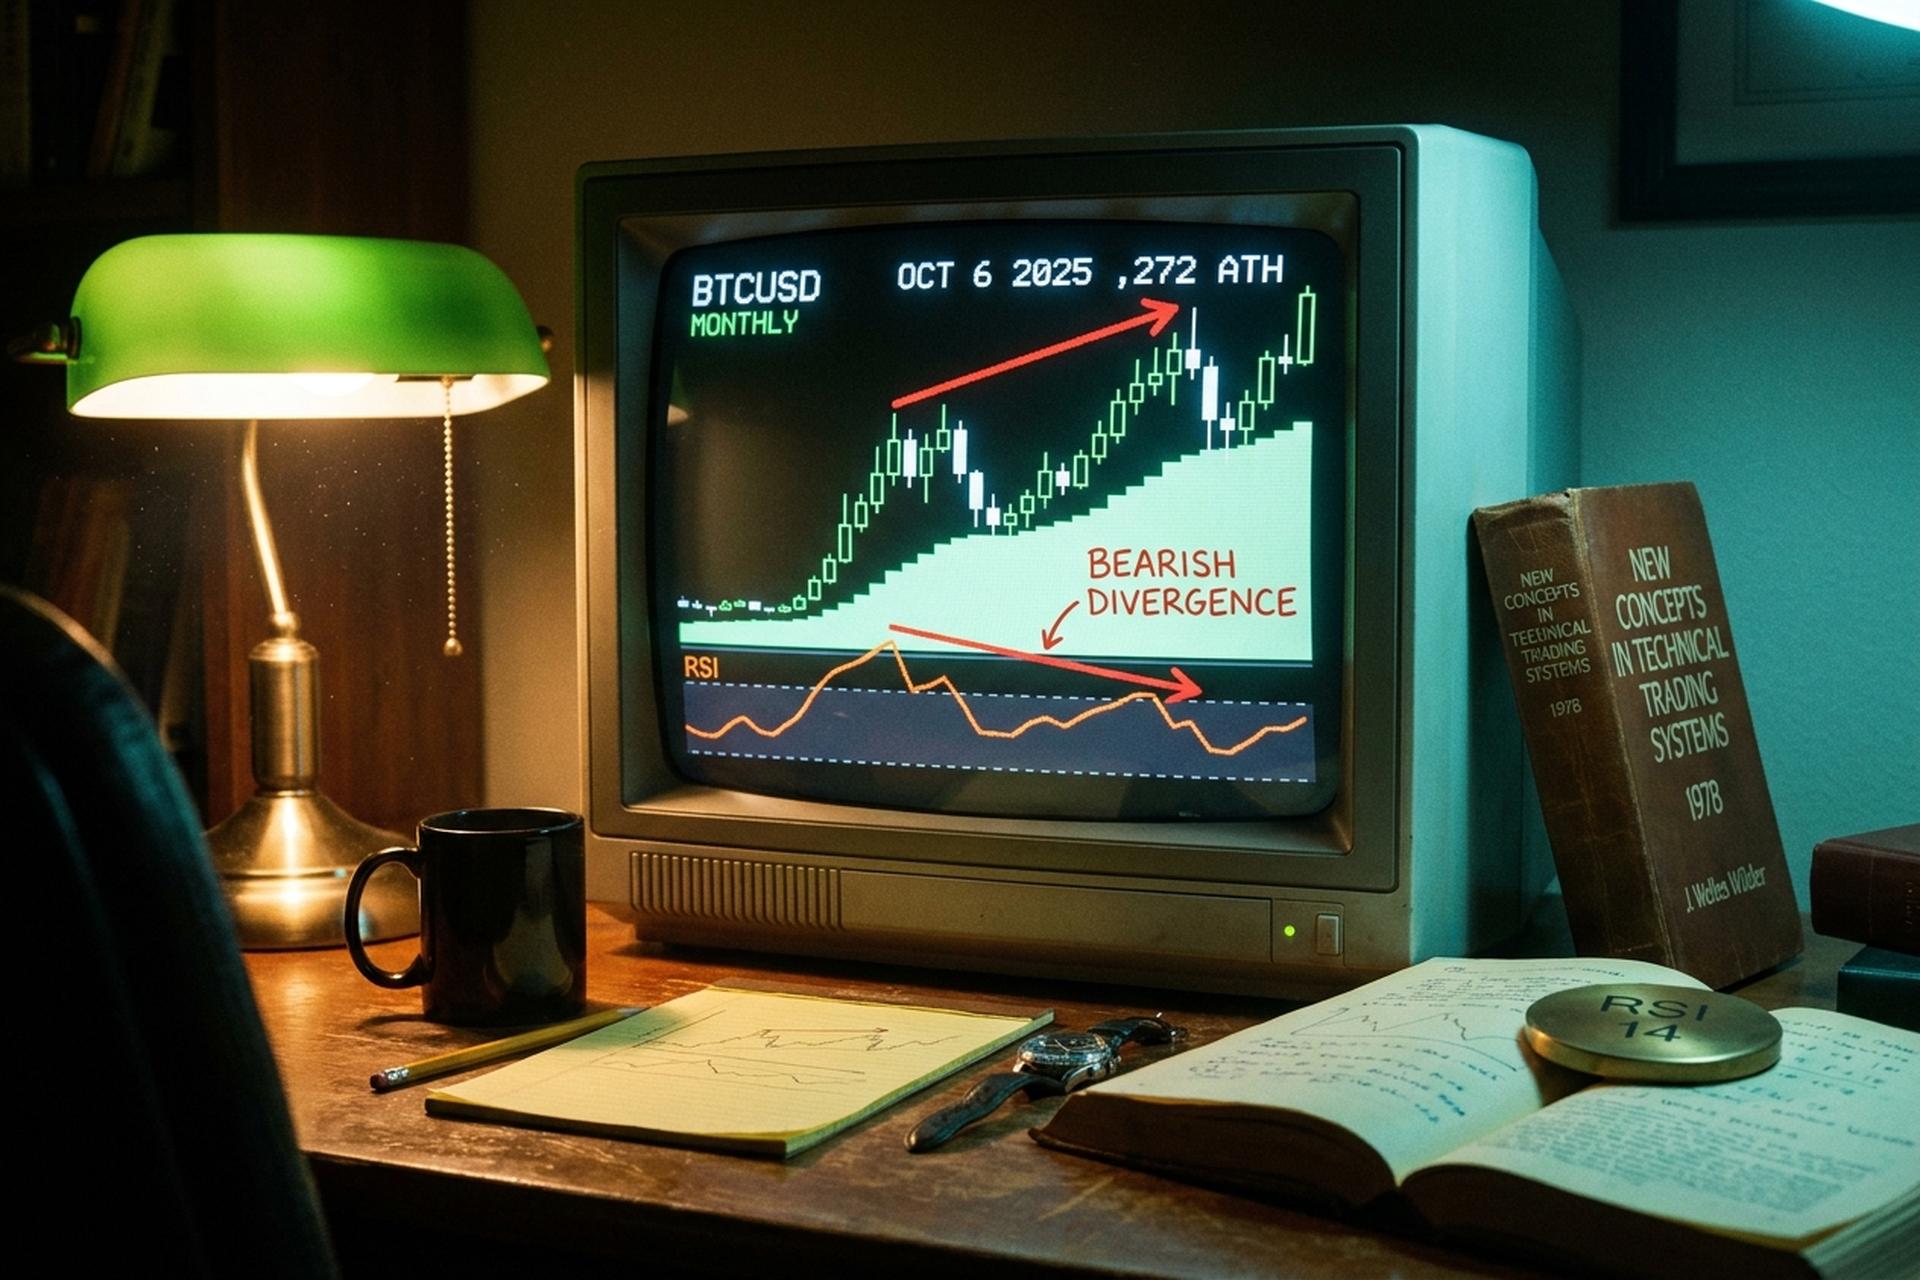
Regular bearish divergence. Price makes a higher high while RSI prints a lower high. Momentum has peaked even as price still climbs. Bitcoin's monthly chart printed this pattern into the October 6, 2025 all-time high of $126,272, the textbook trend reversal case of the cycle. The subsequent correction took the price down roughly 43% by year-end.
Hidden bullish divergence. Price makes a higher low while RSI prints a lower low. This is a continuation pattern, not a reversal: it appears during a pullback inside an uptrend and signals that the trend is still intact even though the indicator looks weak. Traders use it to add to long positions on retracement.
Hidden bearish divergence. Price makes a lower high while RSI prints a higher high. The mirror image of hidden bullish, this is a continuation pattern inside a downtrend. It appears on a relief rally and signals that the downtrend is likely to resume.
| Divergence type | Price pattern | RSI pattern | Implication |
|---|---|---|---|
| Regular bullish | Lower low | Higher low | Possible reversal up |
| Regular bearish | Higher high | Lower high | Possible reversal down |
| Hidden bullish | Higher low | Lower low | Uptrend continuation |
| Hidden bearish | Lower high | Higher high | Downtrend continuation |
How to spot RSI divergence on a chart
Matching swing points is the part most beginners get wrong. A trader spots two prominent peaks in price, glances at the RSI panel, and calls a divergence on instinct. That is not how the pattern works. Both swing points have to be confirmed swing highs or swing lows — meaning a few candles on either side that do not breach the level. The RSI peaks or troughs must be read at the same candles as the price swings, not at nearby RSI peaks that drifted a bar or two off.
Four practical steps cover it.
First, pick a timeframe. Daily and 4-hour are most reliable. Anything below an hour gets dominated by noise on liquid crypto pairs. Second, find two consecutive swing highs or lows in price action. Third, mark the RSI value at each of those swing candles. Not at the nearby RSI peaks. Those typically lag price by a candle. Fourth, draw the lines. If price slope and RSI slope point in opposite directions, the divergence is confirmed.
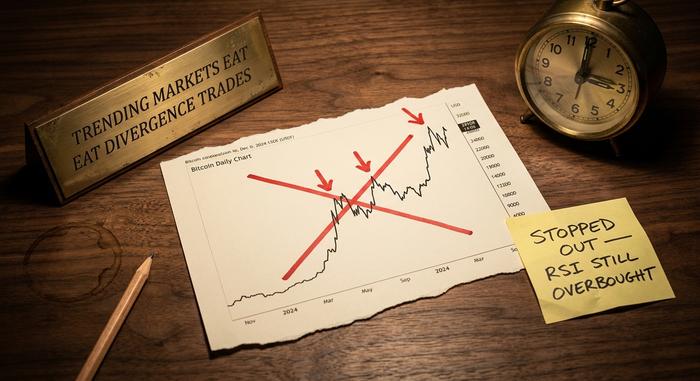
One detail traders skip: wait for the second swing to actually complete before calling the pattern. Premature signals are how strong trends eat divergence shorts alive.
Crypto case studies, 2024 to 2026
Crypto produced three highly instructive RSI divergence episodes in the last two years. Two worked. One did not.
Start with Bitcoin's October 2025 top. By early autumn, BTC was printing fresh all-time highs on the monthly chart. Each new price high came with a lower RSI peak than the one before: textbook regular bearish divergence on the highest timeframe. Bitcoin hit $126,272 on Coinbase on October 6, 2025, then started correcting almost immediately. By year-end it had given back roughly 43%. Several analysts had flagged the divergence in advance. Seeking Alpha published a "Bitcoin Likely Peaked" piece. XT.com flagged the same pattern on the prior weekly chart.
Now Ethereum's August 2025 top. ETH made a new high near $4,953.73 on August 26, 2025. Bearish RSI divergence printed on both the daily and 4-hour charts at the same time. AInvest and Mitrade tracked the setup live, noting weak derivatives positioning and a developing double-top. ETH then retraced to the $4,400 support area within a few weeks.
The third case is the canonical failure. From early 2024 through Bitcoin's first 2024 cycle high near $73,581 in March, BTC climbed from about $30,000 to $70,000 in roughly three months. Daily RSI sat above 70 for stretches of multiple weeks. Traders who shorted on the obvious divergences in March were, in MC2 Finance's bluntly accurate phrase, "steamrolled." That is the most important failure mode of the pattern. In a strong trend, RSI can stay overbought for far longer than a divergence-based stop-loss tolerates.
Combining divergence with other tools
Divergence alone is rarely enough. The standard professional approach is to require a confirming signal from at least one other tool before acting. Four sources of confirmation appear in almost every TA literature: a price-level confluence at meaningful support or resistance, a volume spike on the divergence candle or its reversal, a candlestick pattern such as an engulfing bar or doji at the swing, and a corroborating signal on a second indicator like MACD or stochastics.
A related but less famous Wilder concept is worth knowing alongside divergence. Wilder defined the "failure swing" as a pure-RSI pattern that does not require price comparison. At a market top, the RSI makes a high above 70, retraces, then attempts a second high that fails to exceed the first; when that second peak breaks the trough between them, the failure swing is confirmed as a sell signal. The pattern is the mirror image at market bottoms. Failure swings appear less often than divergence but are more self-contained, which makes them easier to backtest.
RSI divergence vs MACD divergence
Every intermediate trader eventually asks the same question. RSI divergence versus MACD divergence: which is better? The two are related, not identical. RSI is a bounded oscillator capped between 0 and 100. That cap makes overshoot mechanically meaningful. MACD is unbounded: just the difference between two exponential moving averages. It can keep extending. So RSI signals tend to fire earlier, with less lag, in range-bound or choppy markets. MACD does better in trending markets because its longer moving averages filter out noise that RSI registers.
| Aspect | RSI divergence | MACD divergence |
|---|---|---|
| Indicator type | Bounded oscillator (0–100) | Unbounded EMA difference |
| Best market | Range-bound, choppy | Trending |
| Signal speed | Faster, earlier | Slower, lagging |
| Confirmation | Overbought/oversold zones | Signal-line cross, zero cross |
The professional practice is to use both on the same chart and act only when the two agree, because each filters out the other's typical false signals.
When RSI divergence fails: the strong-trend trap
The dominant failure mode is the strong trend. In a sustained directional move, RSI can stay overbought above 70 or oversold (deeply oversell territory) below 30 for weeks, and the divergences that print during that period mean-revert poorly or not at all. The 2024 BTC run is the canonical recent example, but the same pattern appears in any equity index during a momentum-led leg of a bull market.
The crypto regime since 2024 added a second failure mode. Spot Bitcoin ETFs launched in January 2024 and pulled in tens of billions of dollars in institutional flow, while algorithmic market-makers expanded their share of crypto order books. One analysis estimates the combined effect has reduced Bitcoin's realized volatility by roughly 55% versus the previous cycle. Algorithmic mean-reversion bots also explicitly fade short-timeframe RSI divergences faster than they used to, which compresses the lifespan of divergence signals on intraday charts. Higher-timeframe divergence still works because it reflects structural positioning rather than noise.
Conclusion: using RSI divergence in modern markets
RSI divergence is a real and useful pattern. It also carries the same limitation as every other single technical indicator: one input, not a system. The four-pattern matrix (regular and hidden, bullish and bearish) covers every divergence a chart will produce, and higher-timeframe versions still flag exhaustion in modern crypto markets. Treat the signal as a warning, not a trigger. Demand confirmation from price structure, volume, or a second indicator. And respect the strong-trend failure mode. The October 2025 BTC top and the August 2025 ETH top played out on schedule. The 2024 trend run did not. Both outcomes are part of the pattern's track record.


