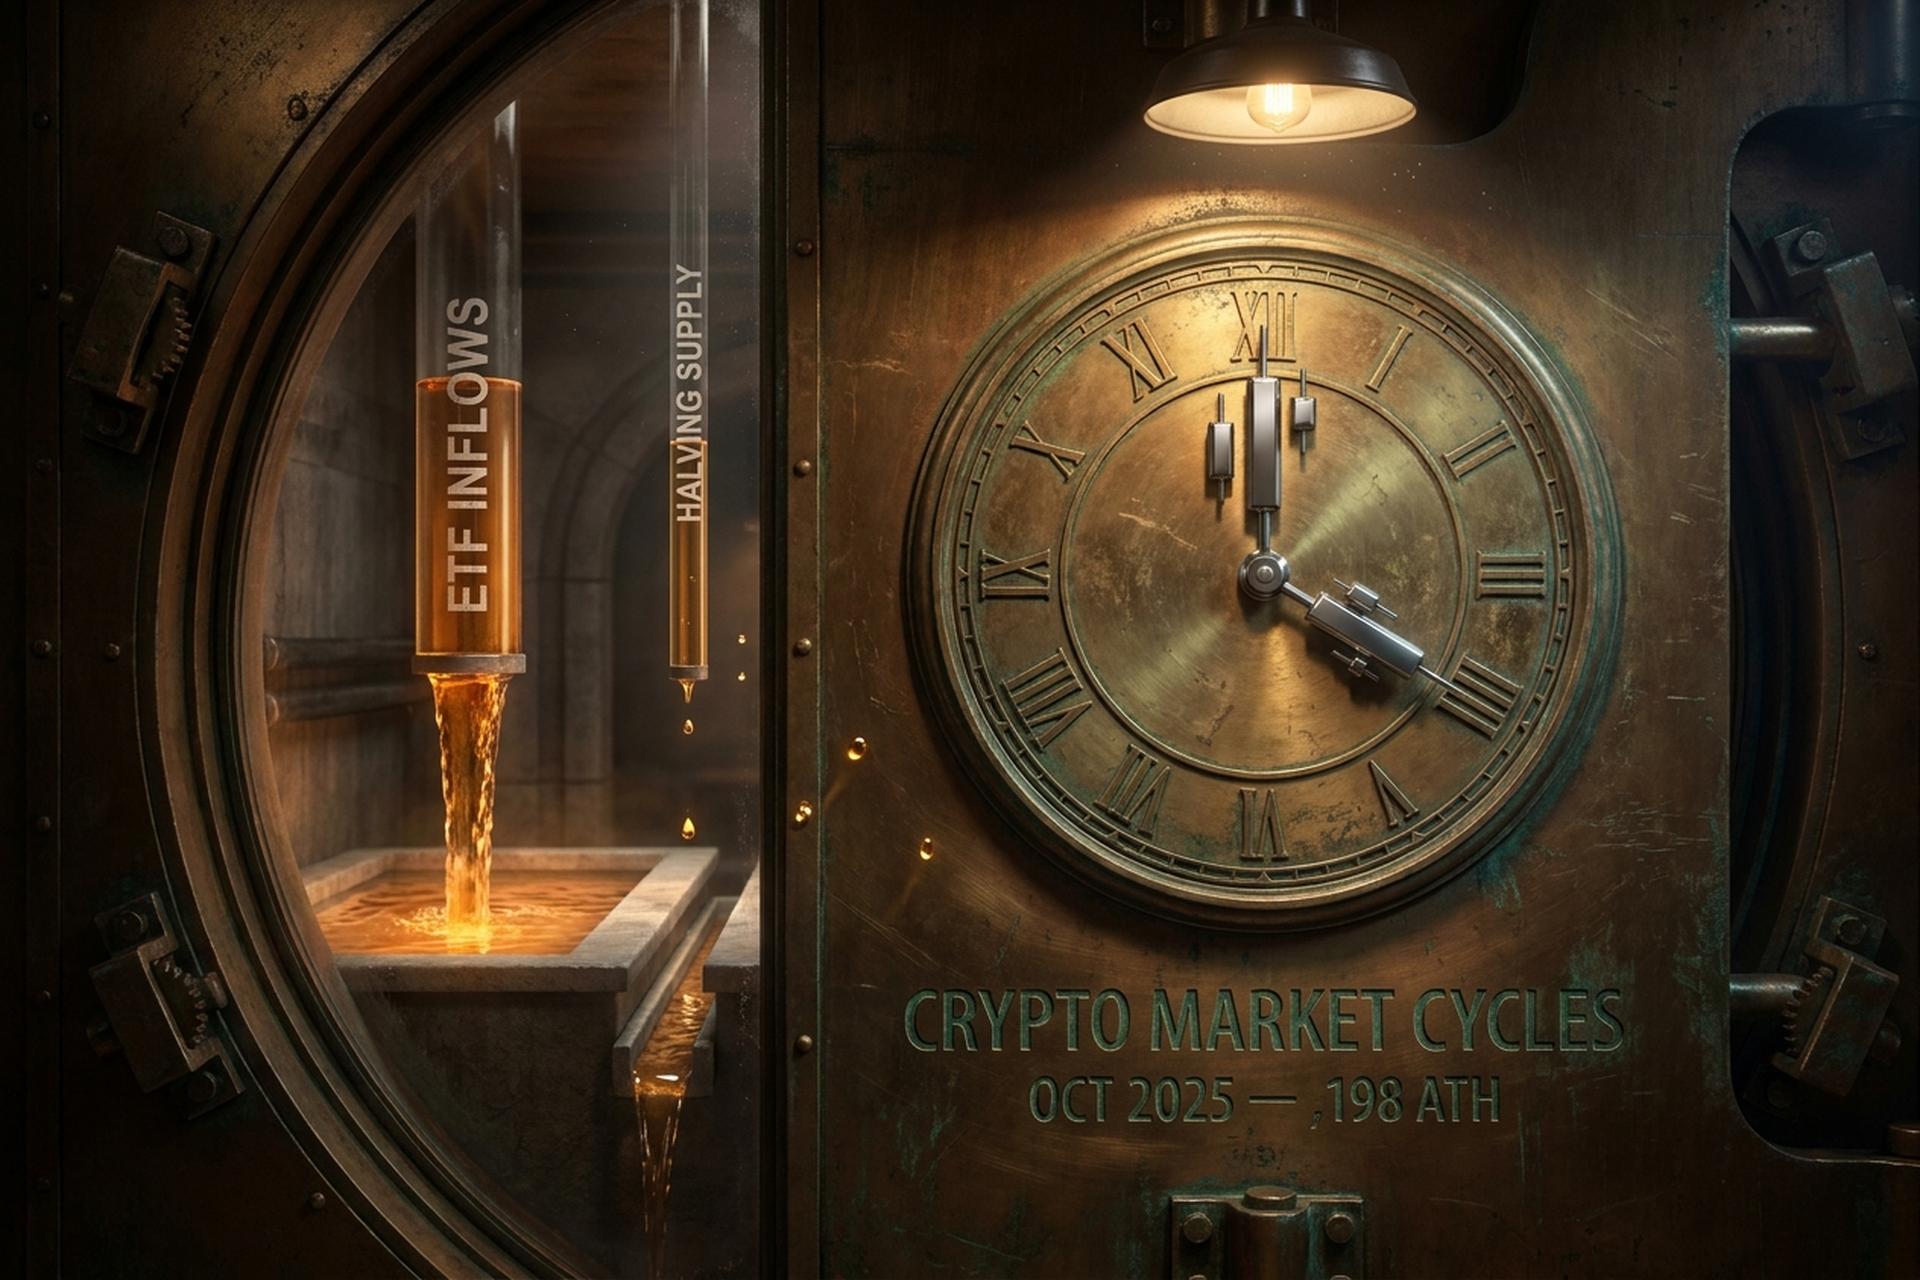
Crypto Market Cycles: 4 Phases, Halving, and 2026 Reality
Crypto market cycles are the most cited and least tested idea in crypto investing. Almost every beginner article on crypto market cycles tells you the same story: the market moves in four-year waves around the Bitcoin halving, the price of Bitcoin runs in halving cycles, a peak lands 12 to 18 months after each event. Buy the bottom. Hold the markup. Sell the top. Survive the bear.
That story worked for three cycles in a row. Then it started to fail. Bitcoin made a new all-time high before the April 2024 halving — first time ever. Spot ETFs pulled in $87 billion since launch. The October 2025 peak landed near where the model predicted, but the drawdown that followed was only −36%, not the textbook −80%. So this guide does what most beginner articles don't: it explains the four-phase model and the halving theory, then puts both against 2024 to 2026 data and shows what broke.
What is a crypto market cycle?
Understanding crypto market cycles starts with one simple definition. A crypto market cycle is the repeating pattern of price movement and price action in the cryptocurrency market between an all-time low and the next all-time high, then back down again. Each phase of the cycle has its own character. In operational terms, the cycle consists of four phases — the round trip from accumulation through bull market, distribution, and bear market, driven by some mix of liquidity, supply, market sentiment, and macro policy. Cycles in crypto are sharper and shorter than the cycles in stocks or commodities because the market trades 24/7, retail margin is heavy, and the supply schedule for Bitcoin is fixed in code. They run on months, not decades. Most full crypto market cycles since 2011 have run somewhere between three and four years, though the boundaries are easier to see in hindsight than in real time.
The four phases of a crypto market cycle
The four phases of the crypto cycle — accumulation, markup, distribution, and markdown — make up the standard frame. It is the textbook market cycle phases scheme, and almost every article on the broader market repeats it. The framework is useful because it maps cleanly onto market psychology and onto historical Bitcoin charts. It is also misleading if you treat the boundaries as crisp. In real time, the phases blur, and the markdown often looks like distribution for months before it commits to a downtrend.
Accumulation phase. A flat range after a bear market. Sentiment is dead, news is bad, retail has stopped paying attention. Trading volume drops, and market participants who stayed in are tired. The famous accumulation window for the last cycle was late 2022 through early 2023, when Bitcoin spent eight months trading between $15,500 and $25,000 after the FTX collapse vaporized confidence. This is the phase where almost nobody buys and a small number of people quietly do.
Markup. The bull market phase. Prices break out, news turns positive, and new participants enter. The 2024–2025 markup carried BTC from about $25,000 in January 2024 to $73,581 in March 2024, a pause, then on to $126,198 in October 2025 — the cycle's all-time high. Fear of missing out drives the late innings of every markup, and a few signature mistakes get repeated: margin at the top, rotation into low-quality alts, retail entries near the peak. Buying bitcoin in the final 10% of a markup has historically been the most expensive thing a beginner can do.
Distribution. The transition between bull and bear. Prices stop making higher highs but trading volume stays elevated as smart money sells into late buying. Sentiment flips from euphoric to mixed. Distribution is the hardest phase to identify in real time because it looks like a healthy consolidation until it does not. Bitcoin's November 2025 through January 2026 sideways action above $100,000 is the most recent example.
Markdown. The bear market. Sentiment turns to fear and capitulation, margin gets liquidated in cascades, and altcoins fall faster than Bitcoin. Drawdowns from cycle peaks have run between −77% and −93% historically. The current cycle has so far produced only a −36% pullback from October 2025 to the early 2026 trough, which is why most analysts call it a mid-cycle correction rather than a real markdown.
| Phase | Sentiment | Trading volume | Typical duration |
|---|---|---|---|
| Accumulation | Fear, apathy | Low | 6–12 months |
| Markup | Optimism → FOMO | Rising | 12–24 months |
| Distribution | Mixed, greed-fading | High but flat price | 3–6 months |
| Markdown | Panic, capitulation | Declining | 6–18 months |
Bitcoin halving and the four-year cycle
Halving is the supply event that anchors the four-year cycle theory. Every 210,000 blocks (roughly four years), the protocol halves what miners earn per block. New bitcoin entering the market gets cut in half overnight. Four halvings down. Nov 28, 2012: 50 → 25 BTC. Jul 9, 2016: 25 → 12.5. May 11, 2020: 12.5 → 6.25. Apr 19, 2024: 6.25 → 3.125. The next one lands around April 2028 at 1.5625 BTC per block. Each cut should, in theory, tighten supply enough to drag a bull run 12 to 18 months out.
The track record looks clean, then weird. CoinGecko Research clocked the first cycle peak at 368 days post-halving. The second took 525. The third, 549. The fourth peak landed roughly 535 days after the April 2024 halving, at $126,198 on October 6, 2025. Timing fits. But for the first time ever Bitcoin also hit an all-time high before the halving — $73,581 on March 14, 2024, a month early. Nothing like that had happened in three prior cycles. The likely cause is structural and obvious in retrospect: spot Bitcoin ETFs launched January 10, 2024, and the buying they pulled forward basically jumped the queue.
The deeper problem is math. Each halving cuts a smaller relative slice of circulating supply than the last one. The 2012 cut hit a tiny float. The 2024 cut went up against 19.7 million already-mined coins. The percentage impact on annual supply is now in single digits, and getting smaller every cycle.
| Halving | Date | New block reward | Days to ATH | Cycle peak |
|---|---|---|---|---|
| 1 | Nov 28, 2012 | 25 BTC | 368 | $1,127 |
| 2 | Jul 9, 2016 | 12.5 BTC | 525 | $19,665 |
| 3 | May 11, 2020 | 6.25 BTC | 549 | $69,044 |
| 4 | Apr 19, 2024 | 3.125 BTC | ≈535 | $126,198 |
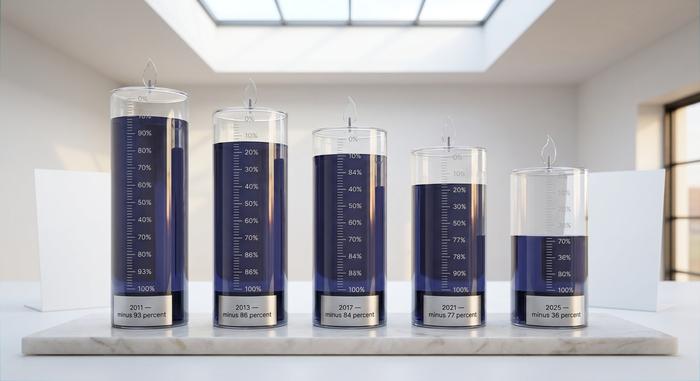
Historical crypto market cycles, 2013 to 2026
Four full cycles is a small sample, and each one had a different macro driver. The standard "halving causes cycle" story misses that the dominant force in each peak was something else.
The 2013 cycle was retail and Mt. Gox. Bitcoin went from under $13 in January to $1,127 in November. The crash that followed wiped −93% from the cycle low, on the back of the Mt. Gox exchange hack and a Chinese regulatory crackdown. The 2017 cycle was the ICO mania. Bitcoin peaked at $19,665 in December 2017, dragged up by an ecosystem of Ethereum-based token launches that raised tens of billions of dollars. The 2018 bear erased −84%.
The 2021 cycle was COVID stimulus and corporate adoption. Easy money, MicroStrategy's first treasury buys, Tesla's purchase, and El Salvador's adoption pushed Bitcoin to $69,044 in November 2021. The unwind across 2022 ran to −77%, with Terra's $50 billion implosion in May and FTX's collapse in November as the proximate triggers. Glassnode logged it as "a bear of historic proportions" even though it was the gentlest drawdown so far.
The 2024–2025 cycle was the institutional cycle. Spot Bitcoin ETFs launched in January 2024 and pulled in $23 billion net in 2025 alone. BlackRock's IBIT manages $66.9 billion as of May 2026. Strategy, the corporate vehicle led by Michael Saylor, held 818,334 BTC by late April 2026, at an average of $75,537 per coin. Bitcoin's October 6, 2025 peak of $126,198 came with total crypto market cap at $4.31 trillion. Then a −36% drawdown to roughly $80,000 by Q1 2026, which CoinDesk and Kaiko both frame as a mid-cycle correction, not the real bear.
| Cycle | Peak month | Peak price | Drawdown | Primary driver |
|---|---|---|---|---|
| 2011 | Jun 2011 | $32 | −93% | Mt. Gox hack |
| 2013 | Nov 2013 | $1,127 | −86% | Retail, Mt. Gox aftermath |
| 2017 | Dec 2017 | $19,665 | −84% | ICO boom |
| 2021 | Nov 2021 | $69,044 | −77% | COVID liquidity, corporate adoption |
| 2025 | Oct 2025 | $126,198 | −36% so far | Spot ETFs, institutional flows |
Indicators traders use to read the cycle
A handful of on-chain and statistical indicators survived multiple cycles and became standard tools for reading cycle phases. None of them works in isolation, and the most famous one just failed.
The Pi Cycle Top indicator compares the 111-day moving average of bitcoin price against twice the 350-day moving average. When the short cross above the long, the indicator flags a likely top. It called the 2013 peak within three days and the 2017 peak within two. It missed the November 2021 peak by a wide margin. As of May 2026, it has not fired at all during the current cycle, which is either evidence that the real top is still ahead or that the indicator's calibration assumed a retail-driven market that no longer exists.
Puell Multiple tracks miner revenue against its 365-day average. Low readings have historically marked cycle bottoms, as miner capitulation flushes weak hands out of the system. MVRV Z-Score compares market value to realized value to flag when Bitcoin is over or undervalued versus on-chain cost basis. It traditionally hits a "pink box" above 7 at cycle tops, but at the October 2025 ATH it never crossed that threshold. Bitcoin Rainbow Chart is a logarithmic visualization that bands "fire sale" to "maximum bubble" ranges across all of Bitcoin's history. The Fear and Greed Index aggregates sentiment from a handful of inputs and produces a 0–100 reading. None of these is predictive on its own; analysts now read them together rather than chasing individual signals.

Is the four-year cycle broken? The 2026 debate
The "cycle is dead" thesis went from a fringe Twitter argument to an institutional consensus inside one year, reshaping how crypto investors talk about market structure and the next cycle. Arthur Hayes argued in October 2025 that the four-year cycle was dead and that prior bear markets were caused by US dollar and Chinese yuan tightening, not the halving. Grayscale's 2026 Digital Asset Outlook, titled "Dawn of the Institutional Era," called for the four-year cycle to officially end this year. Fidelity Digital Assets wrote in 2026 that "persistently low volatility amidst new highs points toward a more mature bitcoin that may not continue to follow the historical four-year cycle pattern." Bitwise CIO Matt Hougan made the same argument: weaker halvings, falling rates, and institutional buyers should push Bitcoin to new highs in 2026 rather than into a textbook bear.
The opposing camp is smaller but not silent. Canary Capital argues the cycle is anchored to miner economics and is still intact. Kaiko Research notes the 2025–2026 decline is consistent with prior post-halving bears so far. Raoul Pal threads the middle path, saying the cycle has stretched into a five-year version with the real peak landing in late 2026, with a stretch target of $450,000 conditional on central-bank liquidity expansion.
The strongest evidence for the "broken" camp is structural ownership. Between spot ETFs holding roughly 1.26 million BTC, Strategy's 818,334 BTC, and the U.S. Strategic Bitcoin Reserve's roughly 200,000 BTC, around 10% of all Bitcoin in existence now sits in institutional or sovereign hands. The price-setting marginal buyer is no longer retail.
What actually changed: ETFs, macro, and altseason
Three structural shifts make this cycle look unlike the previous three. Take them one at a time.
The first is the spot ETFs. Bitcoin ETFs launched Jan 10, 2024. Ethereum ETFs followed in July. Spot BTC ETF AUM crossed $100 billion in early 2026. Bloomberg Intelligence pins 2026 net BTC ETF inflows somewhere between $15 billion (base) and $40 billion (bull). So whatever the halving is doing to bitcoin supply, the ETFs are doing more to demand.
The second is macro policy, which now sets the tempo. The Fed cut rates six times from Sep 2024 through Dec 2025, finishing at 3.5–3.75%. Bitcoin correlation with the S&P 500 climbed to 0.5 in 2025 from 0.29 the year before. That ties crypto assets more tightly to the broader market than they used to be. On March 6, 2025, Trump signed the Strategic Bitcoin Reserve order, making the U.S. government a structural BTC holder. The SEC, under new leadership, dropped its remaining enforcement cases.
The third one is the one nobody saw coming. Altseason did not happen. CoinMarketCap's Altcoin Season Index peaked at 78 in September 2025, scraping into "altseason" for a single window, then collapsed back to about 35 by May 2026. Bitcoin dominance sits between 58% and 60%. The capital that would have rotated into long-tail alts in 2017 or 2021 stayed in BTC and ETH instead. Or it chased Solana memecoins for a few days at a time.
How to navigate crypto market cycles in 2026
The practical takeaway is unglamorous. Time in the market beats timing the market for most retail participants, because cycles are easy to label in hindsight and impossible to call in real time. Dollar-cost averaging across phases captures the bulk of long-term returns without requiring a correct view on where the cycle is. Position sizing should assume a −60% drawdown is still possible even in this maturing market, because Standard Chartered's Geoff Kendrick already cut his 2026 BTC target from $300,000 to $100,000 and warned of a possible dip to $50,000. Watch ETF flows and Fed policy more closely than on-chain indicators. The legacy on-chain stack was built on a retail-driven cryptocurrency market that may not return.
Conclusion: cycles in 2026 versus the original four-phase model
The four-phase shape still describes the crypto market well enough. The four-year halving timing is fading as the structural driver. Treat both as priors, not predictions. The cycle that ends in 2026, whenever and wherever it actually ends, will be the first one in Bitcoin's history where institutional and sovereign demand, not retail FOMO and miner economics, set the marginal price. That alone is enough reason to read every "this time is different" headline with both interest and caution.