Bitcoin Dominance: How to Track BTC.D and Use It for Smarter Trading Decisions
September 2019. Bitcoin dominance sat at 57%. Prices were falling. Sentiment was dead. Nobody on crypto Twitter was talking about altcoins. Six months later, DeFi Summer kicked off and altcoins exploded. The traders who watched BTC.D drop from that 57% peak and rotated early into ETH and DeFi tokens caught one of the most profitable runs in crypto history.
March 2026. Bitcoin dominance is at 56.1%. Highest since April 2021. Prices are down. Sentiment is in the basement (Fear and Greed Index at 9, which is "extreme fear"). The setup looks eerily similar to September 2019. Does that mean altseason is coming? Maybe. Maybe not. But BTC dominance is the metric that tells you when to start paying attention, and I've watched enough of these cycles to know that the time to learn how this indicator works is when it's boring, not when it's screaming.
This article is a practical guide. How BTC.D is calculated, what the numbers actually mean for your portfolio, the four trading scenarios you should know, and the tools and thresholds I personally track.
What bitcoin dominance is and how the math works
The formula is simple. Take Bitcoin's market cap. Divide it by the total cryptocurrency market cap. Multiply by 100. That's BTC dominance, expressed as a percentage.
Right now: Bitcoin's market cap is roughly $1.2 trillion. Total crypto market cap is around $2.1 trillion. 1.2 divided by 2.1 equals about 0.57, or 57%. Bitcoin accounts for 57 cents of every dollar sitting in crypto.
When BTC dominance goes up, it means Bitcoin is either gaining value faster than everything else, or losing value slower than everything else. When it goes down, it means altcoins are outpacing Bitcoin. The metric doesn't tell you whether the market is going up or down. It tells you where money is flowing within the market. That distinction matters a lot and most people miss it.
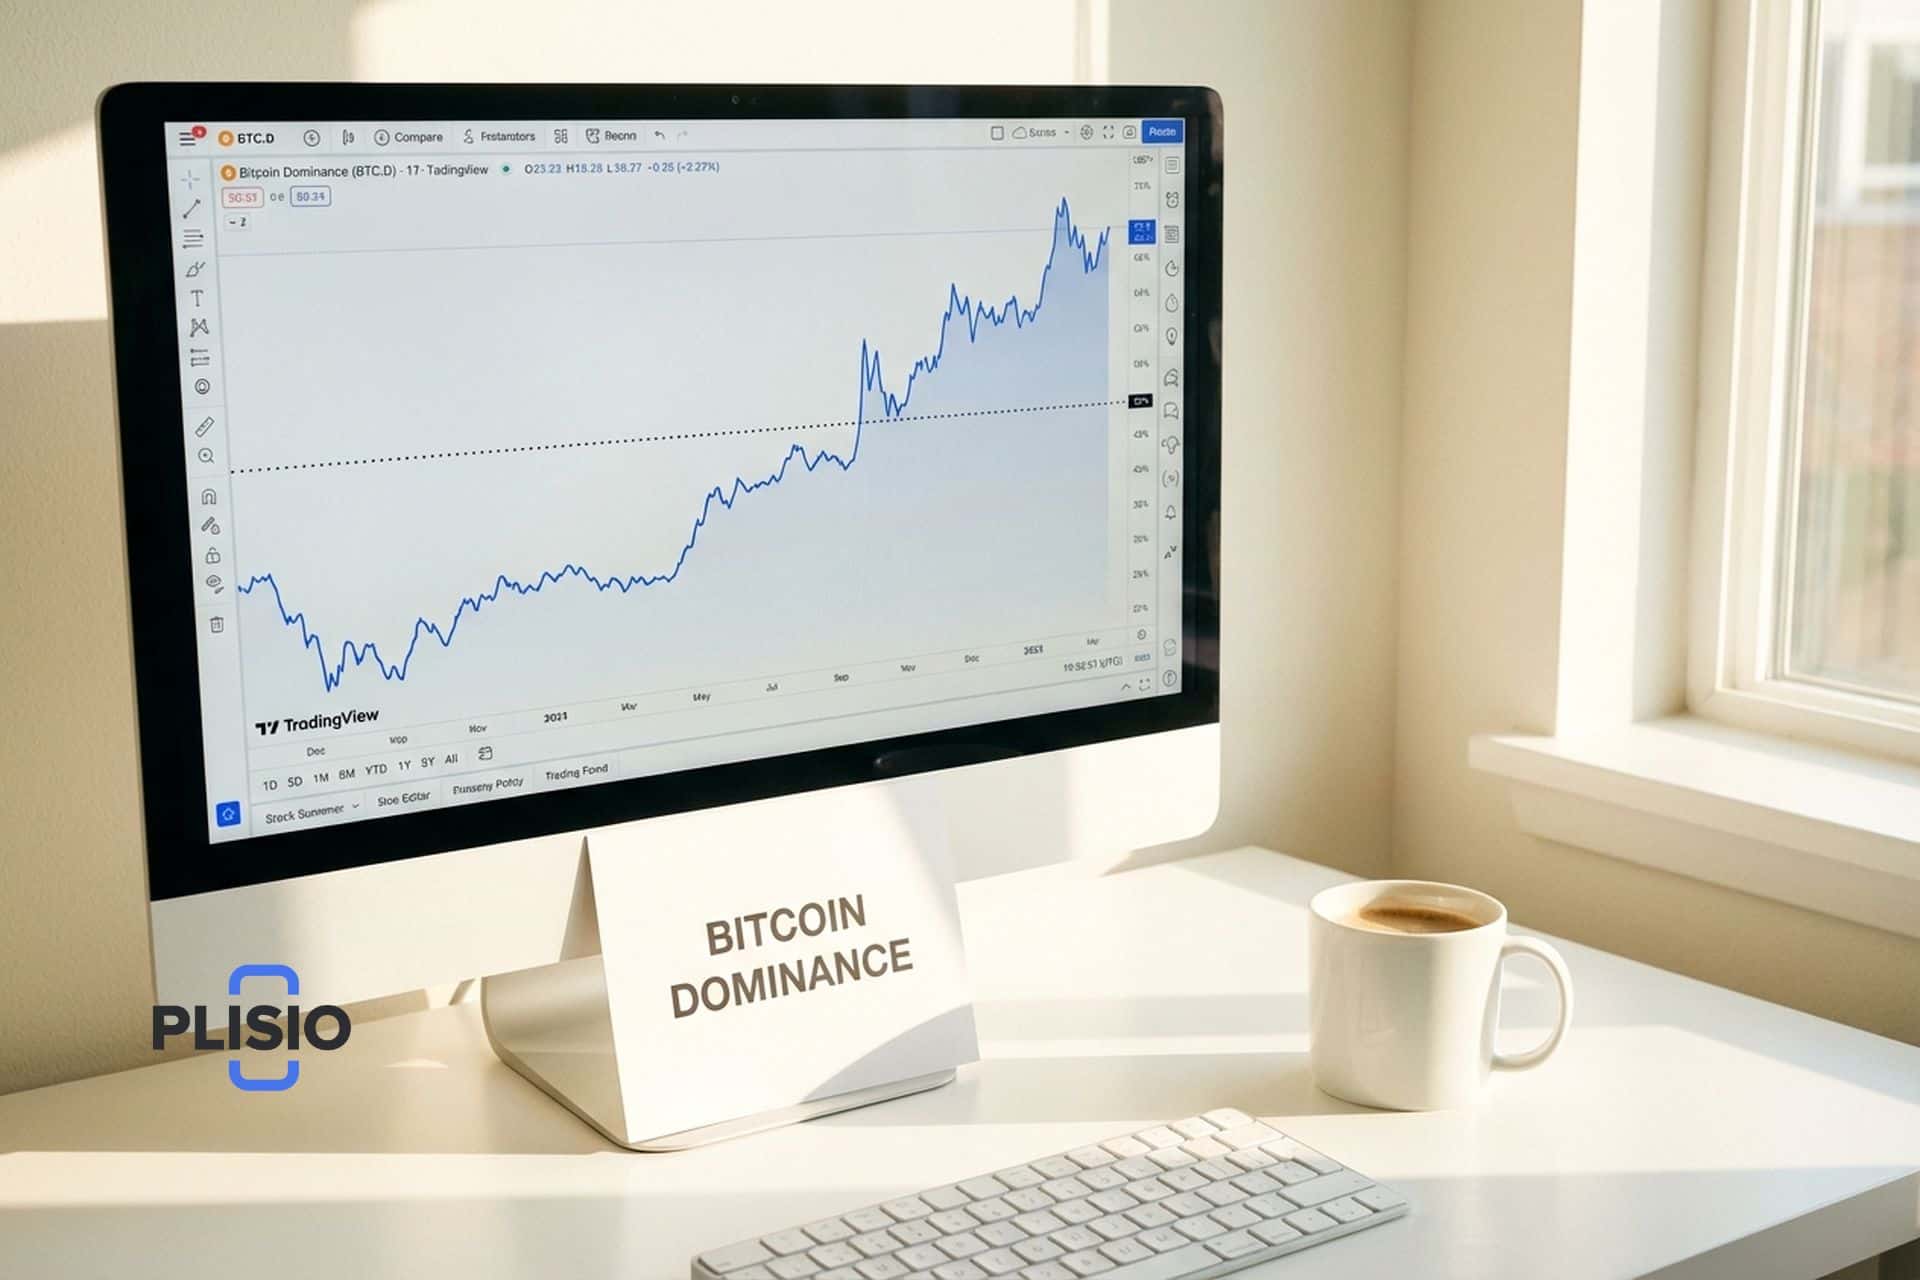
One nuance you should know about: stablecoins. USDT and USDC have a combined market cap of over $200 billion. They're counted in the "total cryptocurrency market cap" denominator but they don't really compete with Bitcoin for capital. Some traders use "BTC dominance excluding stablecoins" to get a cleaner signal. TradingView has this as a separate metric. I prefer watching both and noting when they diverge.
The BTC dominance historical chart: what the cycle data shows
I've pulled the major pivot points from the BTC.D chart going back to when it actually started meaning something. Before 2017, Bitcoin was 85-99% of the market and dominance wasn't useful as an indicator because there was nothing else.
| Period | BTC.D level | What was happening | What followed |
|---|---|---|---|
| January 2017 | 85% | Pre-ICO, few altcoins existed | Massive altseason, BTC.D crashed to 33% |
| January 2018 | 33% | ICO mania peak, euphoria everywhere | Total market crash, BTC.D recovered to 70% |
| September 2019 | 57% | Bear market bottom, dead sentiment | DeFi Summer 2020, then 2021 altseason |
| November 2020 | 70% | Post-COVID recovery, BTC leading | Altseason pushed BTC.D to 38% by June 2021 |
| November 2022 | 48% | Post-FTX crash | Slow grind up, BTC.D rose to 56%+ |
| March 2026 | 56.1% | Current: high dominance, extreme fear | TBD |
The pattern repeats with variations. BTC.D peaks when fear is highest and Bitcoin acts as the "safe haven" of crypto. BTC.D bottoms when euphoria hits and people pile into altcoins chasing 100x returns. The bounce between those extremes is the cycle. Every single time.
Key psychological levels that traders watch: 40% (below this is altcoin mania territory and probably late-stage), 50% (balanced market, rotation could go either way), 60% (Bitcoin is dominant, altcoins are struggling), 70%+ (extreme Bitcoin dominance, often marks a bottom for altcoins and a potential reversal point).
The four trading scenarios: BTC.D plus price action
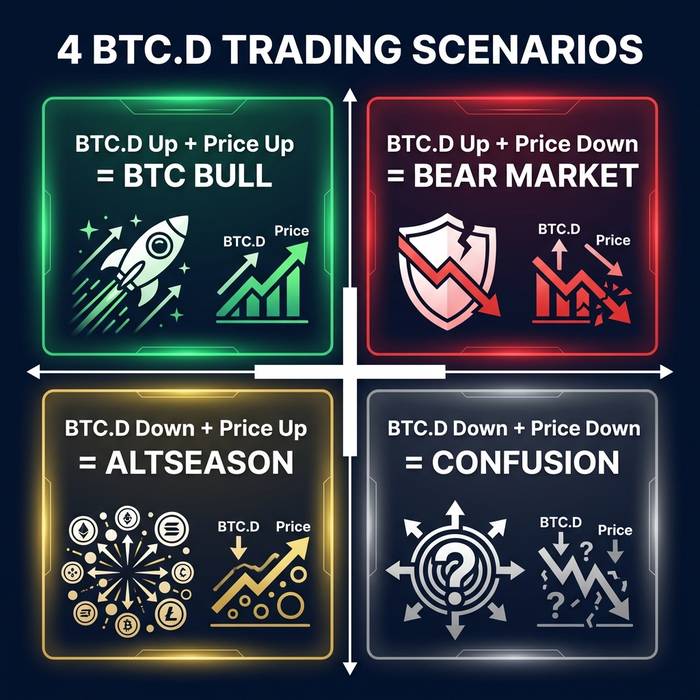
This is the part that changed how I trade crypto. BTC dominance alone tells you half the story. Combining it with whether Bitcoin's price is going up or down gives you four scenarios, each calling for a different response.
Scenario 1: BTC.D rising + BTC price rising. Bitcoin bull market. Fresh money is entering crypto and it's going into BTC first. This is the early phase of a cycle. The play: hold or accumulate Bitcoin. Don't chase altcoins yet. Most of them are flat or slowly bleeding during this phase. Wait.
Scenario 2: BTC.D rising + BTC price falling. This is the scariest quadrant. Everything is going down, but altcoins are going down faster than Bitcoin. Money is fleeing to BTC as the relative safe haven. The play: reduce altcoin exposure aggressively. Move to BTC or stablecoins. This is bear market territory and the altcoins that survive it are the ones worth buying later.
Scenario 3: BTC.D falling + BTC price rising. Altseason. The dream quadrant. Bitcoin is going up but altcoins are going up faster. Capital is rotating out of BTC and spreading across the broader market. This is when ETH, SOL, and the rest of the top 50 put up 3x-10x returns while Bitcoin does 1.5x. The play: rotate a portion of your portfolio into quality altcoins. Not memecoins. Not the latest influencer shill. Projects with active development teams, real users on chain, and growing TVL. In 2021, this scenario played out from January through May. People who caught it early tripled their money. People who FOMO'd in at the end gave it all back.
Scenario 4: BTC.D falling + BTC price falling. Everything is falling but Bitcoin is falling faster than altcoins. This is rare and usually short-lived. It can happen during a BTC-specific event (exchange hack, regulatory crackdown targeting Bitcoin specifically). The play: defensive. Stablecoins or cash. The market is confused and confused markets hurt everyone.
| Scenario | BTC.D | BTC Price | What it means | Action |
|---|---|---|---|---|
| 1 | Rising | Rising | BTC bull, early cycle | Accumulate BTC |
| 2 | Rising | Falling | Bear market, flight to safety | Reduce alts, hold BTC/stables |
| 3 | Falling | Rising | Altseason | Rotate into quality alts |
| 4 | Falling | Falling | Market confusion | Go defensive, stablecoins |
How to track bitcoin dominance in practice: tools and setup
You don't need expensive software. Three free tools cover everything.
TradingView is the standard. The ticker is BTC.D for total dominance and BTC.D excluding stablecoins is available through community-built indicators. You can overlay it with BTC/USD on the same chart, draw support and resistance lines, and set alerts for when BTC.D crosses key levels. I have alerts set at 50%, 55%, and 60%. When one fires, I check the price direction and figure out which of the four scenarios I'm in.
CoinMarketCap shows bitcoin dominance at the top of their homepage. It's the quickest glance. No charting features worth using, but good for a daily check. CoinGecko has a dedicated BTC dominance chart page with more historical data and cleaner formatting than CoinMarketCap.
Glassnode and Dune Analytics offer deeper on-chain versions. You can track BTC dominance by exchange flows (is Bitcoin flowing into exchanges while altcoins flow out, or vice versa?), by whale accumulation patterns, and by derivatives open interest ratios. These are advanced signals and they take time to learn. I'd say it took me six months of looking at Glassnode charts before I could read them intuitively. For most traders, TradingView BTC.D with a BTC/USD price overlay is more than enough. Start simple, add complexity when the simple version stops giving you edge.
One ratio I started tracking after reading the ainvest analysis: (BTC.D + ETH.D) / (USDT.D + USDC.D). This tracks capital allocation between the two major cryptos and the two major stablecoins. When the ratio falls, money is moving to stablecoins (risk-off). When it rises, money is flowing back into risk. It's a cleaner signal than BTC.D alone because it filters out the stablecoin noise.

What to watch right now: the March 2026 setup
I'm not going to pretend I know what happens next. But I can tell you what the data looks like and what the historical analogues suggest.
BTC dominance at 56.1% matches the September 2019 peak almost exactly. That peak preceded DeFi Summer and the 2021 altseason, though the lag was 5-6 months. The November 2020 peak at 70% preceded the 2021 altseason with a 2-3 month lag. The current reading is elevated but not extreme by historical standards.
The Altcoin Season Index sits at 25-35. Firmly Bitcoin season. For altseason to be confirmed, 75% of the top 50 altcoins need to outperform Bitcoin over 90 days. We're nowhere near that.
Stablecoin dominance is at about 10%. That's a lot of dry powder on the sidelines. When that number starts dropping, money is flowing back into risk assets and altcoins typically benefit more than Bitcoin because they're further out on the risk curve.
The Fear and Greed Index reads 9. Extreme fear. People are scared. I've checked this index at every major bottom going back to 2020, and single-digit readings have coincided with good long-term entries more often than not. But "more often than not" is very different from "guaranteed," and I want to be clear about that. The market can stay scared for months.
What would I want to see before rotating into altcoins? BTC.D dropping below 54% and staying there for two consecutive weekly closes. The Altcoin Season Index crossing 40 and trending up. Stablecoin dominance falling from 10% toward 7-8%. Any one of these alone is just noise and you'll get faked out acting on it. All three together is a signal worth trading around.
The limitations: why BTC.D isn't a crystal ball
BTC dominance is useful but it's not magic and I've watched it mislead people who treat it as a standalone trading signal.
The metric includes everything in the crypto market cap, which means it's diluted by new token launches. Every time a new meme coin or L2 token launches with a high fully diluted valuation, the total crypto market cap goes up slightly and BTC.D goes down slightly, even if no capital actually moved away from Bitcoin. This creates false altseason signals during periods of heavy token launches.
Lost coins aren't accounted for. An estimated 3-4 million BTC are permanently lost (early mining, lost keys). They're still counted in Bitcoin's market cap. If you subtracted them, BTC dominance would be 5-10% lower than reported.
Liquidity gaps matter. Many altcoins have market caps based on thin trading volume. Their reported caps inflate the total market denominator. The "Real Bitcoin Dominance Index" (which counts only proof-of-work coins) sometimes shows BTC at 70%+ when the standard measure shows 55%.
And the structural shift nobody talks about enough: ETF flows. Since 2024, tens of billions of institutional money entered Bitcoin through spot ETFs. That money doesn't rotate into altcoins. A Fidelity or BlackRock allocation to BTC stays in BTC. The fund manager at a pension fund isn't selling their Bitcoin ETF position to buy Solana memecoins. As institutional share of the market grows (and it's growing fast, with ETFs now holding over 1 million BTC collectively), the traditional "BTC leads, then money rotates to alts" dynamic may permanently weaken. The capital coming in through ETFs was never going to touch altcoins, so counting it in BTC dominance might overstate how much "rotatable" capital is actually in Bitcoin.
I don't think BTC dominance is broken as a metric. But I do think the 2017 and 2021 playbooks need updating. The market structure has changed. Institutional money is a bigger piece of the pie. Stablecoins are a bigger share of total cap. New tokens launch every day and inflate the denominator. Use BTC.D as one signal in a dashboard of five or six signals, not as the only number you watch.


