Crypto volatility: why prices swing so hard and what smart investors do about it
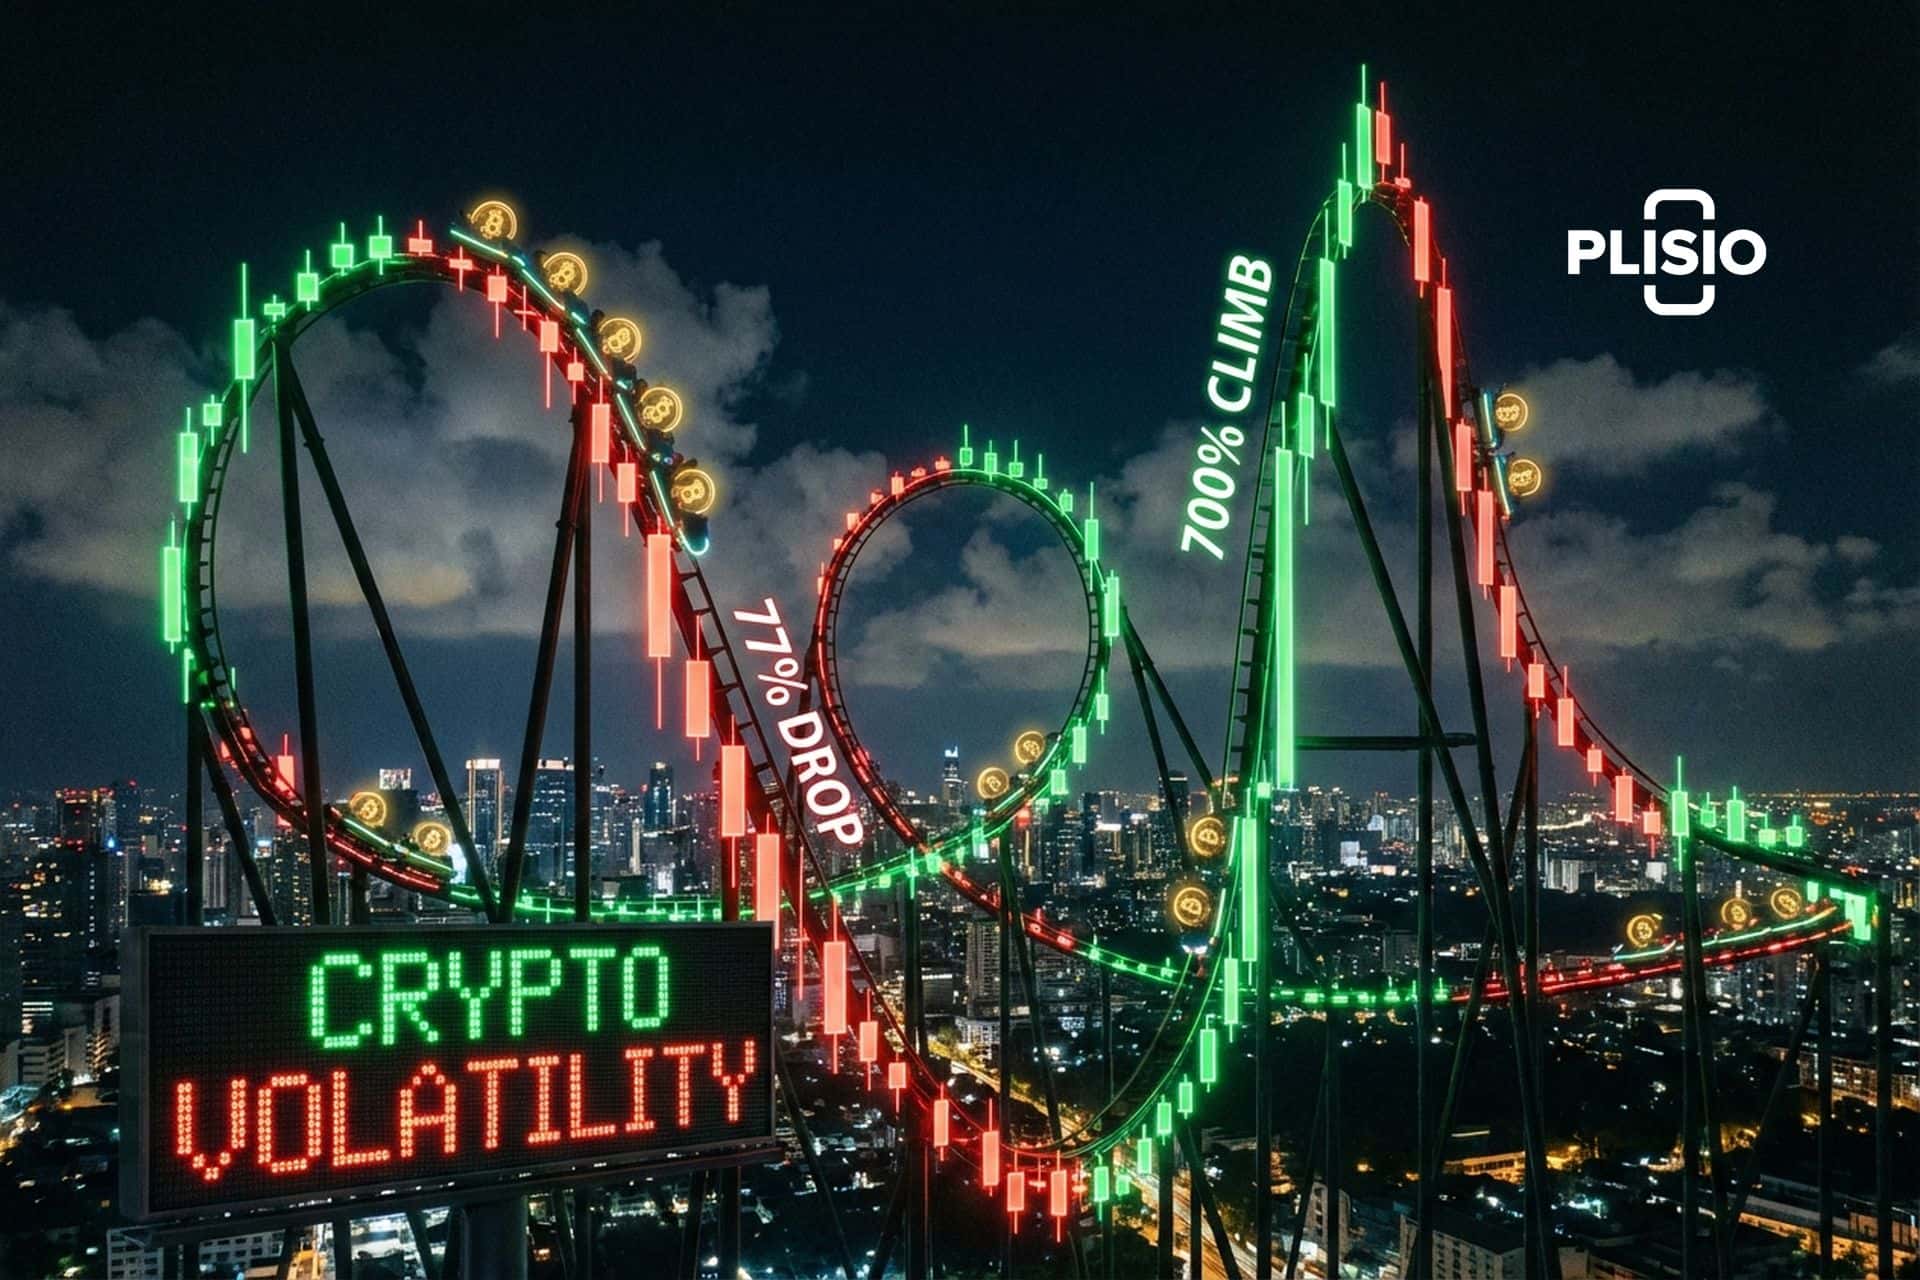
Bitcoin dropped 77% between November 2021 and November 2022. Then it climbed 700% from that bottom to a new all-time high in October 2025. Then it fell 46% by April 2026. That kind of movement would cause a national crisis if it happened to the US dollar. In crypto, it's just Tuesday.
Volatility is the single most defining feature of the cryptocurrency market. It's what makes crypto attractive to traders and terrifying to anyone who thinks of their portfolio before falling asleep. But volatility isn't random noise. It has causes, patterns, and, most importantly, strategies that help you survive it. This article explains what crypto volatility actually is, why it happens, how it's measured, and what you can do beyond just hoping for the best.
What volatility means in the crypto market
Volatility measures how much and how fast an asset's price moves over a given period. A volatile asset has large price swings. A stable asset doesn't. The US dollar's purchasing power changes by maybe 2-4% per year against a basket of goods. Bitcoin's price can move 10% in a single day.
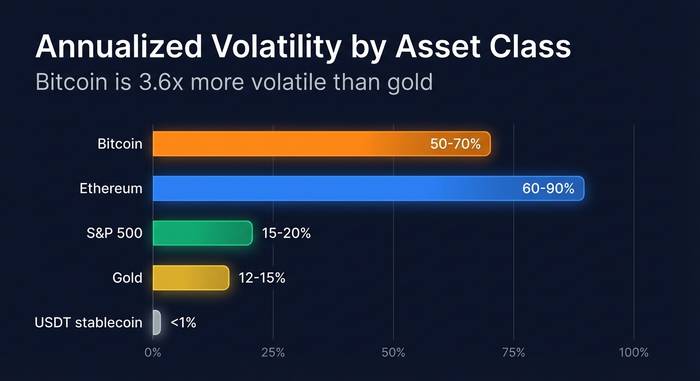
In traditional finance, volatility is usually measured as the standard deviation of returns over a period, typically 30 days or one year, then annualized. When someone says "Bitcoin's 30-day realized volatility is 55%," they mean that BTC's daily price changes, annualized, produce a standard deviation of 55%. For comparison, the S&P 500 historically sits around 15-20% annualized volatility. Gold runs about 12-15%.
Bitcoin's volatility has been consistently 3.6 times that of gold and 5.1 times that of global equities, according to Fidelity Digital Assets research. That ratio has actually been declining as the market matures, but crypto is still far more volatile than any traditional asset class.
Two types of volatility matter:
Historical (realized) volatility: What actually happened. Calculated from past price data. Useful for understanding what you've been through.
Implied volatility: What the options market expects will happen. Derived from options pricing. The Deribit DVOL index and the CME CF Bitcoin Volatility Index (BVX) track this for BTC. When implied volatility spikes, it means traders are bracing for big moves.
| Asset | Annualized volatility (typical) | Max drawdown (recent cycle) |
|---|---|---|
| Bitcoin (BTC) | 50-70% | -77% (Nov 2021 to Nov 2022) |
| Ethereum (ETH) | 60-90% | -82% (same period) |
| S&P 500 | 15-20% | -25% (2022) |
| Gold | 12-15% | -21% (2020 COVID flash) |
| USDT (stablecoin) | <1% | Brief depeg to $0.97 (May 2022) |
Why the crypto market is so volatile
Crypto doesn't swing wildly because the technology is broken. It swings because of structural features that traditional markets either don't have or have managed to dampen over centuries.
Small market cap relative to global finance. Bitcoin's market cap is roughly $1.3 trillion. The entire crypto market is around $2.5 trillion. The S&P 500 alone is worth about $45 trillion. When a market is smaller, it takes less money to move prices. A $500 million sell order in US equities barely registers. In crypto, it can crash a token 20%.
24/7 trading with no circuit breakers. Stock exchanges halt trading when prices drop too fast. Crypto never stops. Markets run around the clock, 365 days a year. There's no closing bell, no timeout, no NYSE official stepping in to pause things. A crash that starts at 3 AM on a Sunday keeps going until buyers show up. Liquidation cascades in leveraged positions can accelerate sell-offs without any human intervention.
Leverage and derivatives. Crypto exchanges offer 10x, 50x, even 100x leverage on futures contracts. When prices move against leveraged positions, forced liquidations dump additional selling pressure onto the market. During the May 2021 crash, over $8 billion in leveraged positions were liquidated in 24 hours. That feedback loop, where falling prices trigger liquidations that cause more falling, amplifies volatility massively.
Sentiment-driven pricing. Most cryptocurrencies don't generate revenue or pay dividends. There's no earnings call to anchor valuation. Prices reflect what people believe the asset will be worth, and beliefs change fast. A single tweet from Elon Musk moved Dogecoin's market cap by billions in 2021. Media coverage, influencer opinions, and viral memes can shift millions of dollars in minutes.
Regulatory uncertainty. When China banned crypto mining in 2021, Bitcoin dropped 55% in two months. When the US approved Bitcoin spot ETFs in January 2024, BTC rallied 60% in three months. Regulatory decisions are binary events with massive market impact, and in crypto, they come from dozens of jurisdictions with no coordination.
Whale concentration. Large holders ("whales") can move markets. On-chain data shows that roughly 2,000 addresses control about 40% of all bitcoin. When a whale moves a significant amount to an exchange, the market often interprets it as a sell signal and prices drop preemptively. This concentration doesn't exist in the same way in the S&P 500, where the top 2,000 shareholders own a far smaller percentage.
Low liquidity in altcoins. Bitcoin and Ethereum have deep order books on major exchanges. Most other tokens don't. A $100,000 market sell order on a small-cap coin can crash its price 30-50%. This makes altcoins far more volatile than BTC or ETH. If you're trading anything outside the top 20 by market cap, the liquidity risk is real. Slippage alone can cost you 2-5% on a single trade.
FOMO and FUD cycles. The crypto market runs on emotion more than most investors want to admit. Fear of missing out (FOMO) drives buying frenzies. Fear, uncertainty, and doubt (FUD) triggers panic selling. Social media makes both worse. A rumor about a country banning crypto can erase $200 billion in market cap in hours. A rumor about a major company buying bitcoin can add the same amount back. The speed of information (and misinformation) in crypto is much faster than in stock markets, where news gets filtered through regulated disclosure processes.
How to measure crypto volatility yourself
You don't need a Bloomberg terminal. Several free tools track Bitcoin and crypto market volatility in real time:
| Tool | What it shows | URL |
|---|---|---|
| BitVol (T3 Index) | Bitcoin 30-day implied volatility index | bitvol.info |
| Deribit DVOL | BTC and ETH implied volatility from options | deribit.com |
| The Block | Annualized 30-day BTC realized volatility chart | theblock.co |
| CoinGlass | Historical volatility, funding rates, liquidations | coinglass.com |
| Bitbo | Bitcoin volatility vs. S&P 500, gold, currencies | bitbo.io |
The simplest approach: check Bitcoin's 30-day realized volatility. If it's below 40%, the market is relatively calm. If it's above 70%, expect significant price swings in either direction. Anything above 100% is peak chaos, usually coinciding with major crashes or euphoric blow-off tops.
Strategies for dealing with crypto volatility
Volatility isn't going away. The question is what you do with it.
Dollar-cost averaging (DCA)
Instead of trying to time the market, invest a fixed amount on a regular schedule: $100 every week, or $500 every month. When prices are high, you buy less. When prices are low, you buy more. Over time, this smooths your average entry price and removes the emotional component of "should I buy now or wait for a dip?"
DCA has worked well for most people in crypto. Not because the math is always better than buying a lump sum at the right time. But because DCA stops you from making the one mistake that ruins everything: panic selling after a 50% drop. When you buy small amounts regularly, you've trained yourself to buy when prices fall. That habit alone is worth more than any clever trading strategy.
One more thing about DCA: it works best when you commit to a schedule and don't skip weeks because the price is "too high" or "about to crash." The whole point is that you don't predict. You just keep buying.
Position sizing
Never put more into crypto than you can afford to watch drop 70% without needing to sell. That sounds extreme, but drawdowns of that magnitude have happened in every single crypto cycle. If a 50% drop would force you to sell because you need the money for rent, your position is too large.
A common framework: keep crypto at 5-15% of your total investment portfolio. Enough to benefit from upside, small enough that a crash doesn't ruin your financial life.
Stablecoins as a volatility shelter
When you want to stay in the crypto ecosystem without exposure to price swings, stablecoins like USDC and USDT maintain a roughly 1:1 peg to the US dollar. You can park funds in stablecoins during uncertain periods and redeploy when you see opportunity. Some investors earn 3-8% APY lending stablecoins through DeFi protocols, essentially getting a yield while sitting on the sidelines.
Hedging with options and futures
More advanced traders use Bitcoin options to hedge downside risk. Buying put options sets a floor on your losses while allowing unlimited upside. Selling covered calls generates income from your existing holdings in exchange for capping your upside. These strategies require understanding derivatives and carry their own risks, but they're increasingly accessible through platforms like Deribit and CME.
Understanding the cycle
Crypto markets have historically moved in roughly four-year cycles tied to Bitcoin halvings. While the pattern may be weakening (the 2024 cycle delivered only 98% returns vs. 9,520% in 2012), understanding where you are in the cycle helps calibrate expectations. Buying during peak euphoria is the most expensive mistake. Buying during deep bear markets, when fear is highest, has historically produced the best returns.
Is crypto volatility decreasing over time?
Bitcoin's volatility has been on a long-term downtrend. In 2011, BTC's annualized volatility frequently exceeded 200%. By 2020, it was typically in the 60-80% range. In 2025-2026, it hovers around 45-65%. The trend is clear: as market cap grows, institutional participation increases, and infrastructure matures, extreme moves become less common.
That doesn't mean crypto is "safe" now. A 45% figure is still three times higher than the S&P 500. And altcoins remain wild. A mid-cap token can double in a week and lose 60% the next. But the trend line is clear: Bitcoin is slowly getting calmer. Whether it ever reaches the volatility level of gold or blue-chip stocks is an open question. I doubt it will in the next decade. But the 200% volatility days of 2011 are gone, probably for good.
What's driving this decline? More money in the market. Bitcoin spot ETFs now hold tens of billions in assets. Institutional investors bring larger, slower-moving capital. Options markets let traders hedge instead of panic selling. The infrastructure of a mature market dampens extreme swings, even if it can't eliminate them. Each cycle seems to produce smaller percentage moves in both directions, which is exactly what you'd expect from an asset class growing up.


