Nasdaq 100 Explained: NDX Index, Benchmark, and Real Risks

Most articles about the Nasdaq 100 give you the headline number, list the famous tickers, and stop. That leaves out the two things a new investor actually needs to know before buying a share of QQQ. First, the index is now concentrated in a way that makes the word "diversified" feel generous: the top 10 components made up 47.4% of the Nasdaq 100 as of May 15, 2026, and the chip cluster alone — Nvidia, AMD, Broadcom, Micron — accounts for nearly a fifth of the entire benchmark. Second, the long-run return story (around 14% annualized since 1985) was earned the hard way, through one drawdown that fell roughly 78% and took fifteen years to fully recover. The Nasdaq 100 has beaten the S&P 500 by about 199 cumulative percentage points over the past two decades, which is enough to make any beginner curious. The point of this guide is to explain how the Nasdaq 100 works, why its rules matter, and what its history tells you about what owning it actually feels like.
What the Nasdaq 100 actually is (and what it isn't)
Start with the plain definition. NDX is a stock market index of the 100 biggest non-financial companies trading on Nasdaq. Simple. Almost. The "100" is mildly misleading because right now the index actually holds 102 securities — Alphabet and a couple of others count under multiple share-class tickers. At year-end 2025 the combined market capitalization came in near $33.7 trillion. You will see that number repeated a lot in coverage.
Three things newcomers regularly get wrong. People mix up the Nasdaq 100 with the Nasdaq Composite. Different beasts. The Composite covers more than 3,000 stocks; the 100 only watches the largest non-financials, period. Next, the Nasdaq 100 is not restricted to American firms — names from Canada, the Netherlands, Ireland, and a few other places qualify if they happen to list on Nasdaq. Finally, financial companies are deliberately excluded. So no Goldman Sachs, no JPMorgan, no Bank of America at all. What you do see, in heavy concentration: software houses, semiconductor makers, communication services, healthcare and biotechnology firms, plus consumer discretionary giants like Amazon and Tesla. A wide range of businesses, sure, but the shared DNA is growth-and-innovation rather than dividends, and together they make up the 21st century technology benchmark anchoring trillions in investment products worldwide.
Inside the index methodology: how Nasdaq weights its components
The Nasdaq 100 is a modified capitalization-weighted index, and the word "modified" is doing the real work. In a pure cap-weighted index, the biggest company by market cap would simply get the largest weight. Here the formula starts that way, then applies caps designed to keep any single name or any cluster of giant names from swallowing the index. The mechanics are unglamorous, but they explain the news headlines you may have seen about an emergency rebalance in 2023.
There are three different rebalances to keep in mind. The annual reconstitution happens on the third Friday of December, when Nasdaq reviews eligibility and resets weights for the next year. A quarterly rebalance fires in March, June, September, and December if certain thresholds are tripped — for example, if one stock has climbed past 24% of the index, or if all stocks weighing 4.5% or more together exceed 48% of the index. And then there is the special rebalance, which Nasdaq invokes when those caps get breached between scheduled dates.
That last one is exactly what happened on July 24, 2023, when the Magnificent Seven had pushed the top-7 cluster to roughly 55% of the index — heavily weighted enough to bend the chart of any fund tracking it. Nasdaq cut their combined weight back to about 43% overnight and recalculated the divisor used to scale the index. The reasoning was practical rather than philosophical: many funds tracking the Nasdaq 100 are registered under US tax rules that require diversification limits, and an over-concentrated index puts those structures at risk.
| Rebalance type | When it happens | What triggers it |
|---|---|---|
| Annual reconstitution | Third Friday of December | Scheduled review of eligibility |
| Quarterly | March, June, September, December | Stock ≥24% weight; or ≥48% combined for stocks ≥4.5% |
| Special (off-cycle) | Any time | Caps breached between scheduled dates (e.g. July 24, 2023) |
Eligibility itself is straightforward. A company has to be listed exclusively on the Nasdaq stock exchange, trade for at least three months, average about 200,000 shares of daily trading volume, file current SEC reports, and not be in bankruptcy. There is no profitability test, which is why fast-growing but unprofitable firms can sit alongside dividend-paying giants. Investors who pay attention to index methodology will recognize that this is the same family of rules used by the Nasdaq Financial-100 and other separate index products from Nasdaq.
Top 10 components carry almost half the Nasdaq-100 index
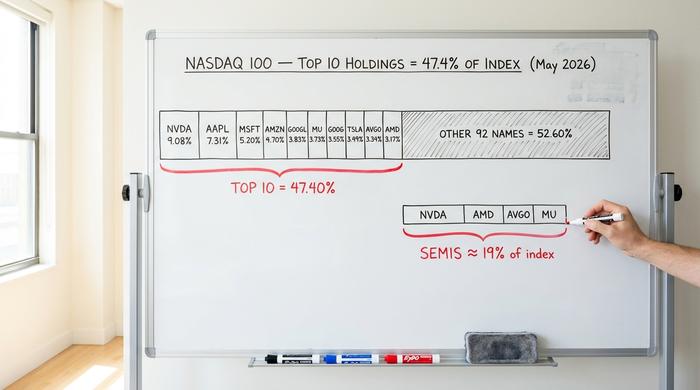
Look at the actual weights and the concentration story becomes hard to ignore. As of May 15, 2026, the top ten holdings break down like this.
| Rank | Company | Ticker | Weight |
|---|---|---|---|
| 1 | Nvidia | NVDA | 9.08% |
| 2 | Apple | AAPL | 7.31% |
| 3 | Microsoft | MSFT | 5.20% |
| 4 | Amazon | AMZN | 4.70% |
| 5 | Alphabet (Class A) | GOOGL | 3.83% |
| 6 | Micron Technology | MU | 3.73% |
| 7 | Alphabet (Class C) | GOOG | 3.55% |
| 8 | Tesla | TSLA | 3.49% |
| 9 | Broadcom | AVGO | 3.34% |
| 10 | AMD | AMD | 3.17% |
The top 10 combined account for 47.40% of the Nasdaq 100. The Magnificent Seven cluster — Nvidia, Apple, Microsoft, Amazon, Alphabet, Meta, and Tesla — sits around 40 to 45% on its own. For comparison, the same seven names make up about 34.8% of the S&P 500, which is itself widely described as too concentrated. The Nasdaq 100 is more concentrated still.
There is a second concentration story underneath the company-level one, and it is the part most coverage misses. Add up Nvidia, AMD, Broadcom, and Micron and you have roughly 19% of the entire index sitting in semiconductors alone. If you own a Nasdaq 100 fund as your "stock" allocation, almost a fifth of your equity exposure depends on the demand cycle for chips. That is not necessarily bad. It is just not what most beginners think they are buying when a financial advisor describes QQQ as "a diversified index of leading companies."
The communication services sector adds Alphabet and Meta on top of that. The consumer discretionary block adds Amazon and Tesla. By the time you account for the major software names, technology and tech-adjacent businesses account for somewhere between 60 and 65% of the Nasdaq 100. It is a tech bet with a few non-tech names attached, and pretending otherwise is the part I find frustrating about most "Nasdaq 100 for beginners" content.
Three Nasdaq 100 crashes the marketing won't show you
The other half of the picture is what happened in the bad years. The Nasdaq 100 has produced an annualized total return of about 14.25% since launch in 1985, but anyone who lived through the full path also lived through the worst drawdown of any major US stock market index in modern history.
| Crash | Peak-to-trough drawdown | Time to recover to prior high |
|---|---|---|
| Dot-com bust (2000-2002) | About -78% to -83% | About 15 years (recovered by April 23, 2015) |
| Global Financial Crisis (2007-2009) | About -53.5% | About 2 years |
| Inflation/rate hike bear (2022) | -32.97% | About 18 months |
| Tariff shock (2025) | About -24% (low on April 8, 2025) | About 6-8 weeks (post tariff-pause rally) |
The dot-com number deserves its own paragraph. After hitting a milestone above 4,700 in March 2000, the Nasdaq 100 lost between four-fifths and five-sixths of its value over the next two and a half years. An investor who bought the index at the top did not see their position recover, in nominal terms, until April 2015. Adjusted for inflation, the wait was longer. That is the kind of timeline that makes a difference between "long-term investor" and "person who actually held through it."
The 2008 episode was severe but historically ordinary by Nasdaq 100 standards. The 2022 drawdown was modest in comparison and recovered quickly. The most recent test was the April 2025 tariff shock, when a -24% drop unwound in roughly six to eight weeks after the policy pause. Bloomberg also confirmed a renewed correction in March 2026 driven by falling big-tech share prices, although the index has stabilized since then.
I'm not convinced the next drawdown looks like the last one. The Nasdaq 100 currently trades at a price-to-earnings ratio of 37.84 versus a historical median closer to 24.49. That kind of valuation gap does not predict a crash, but it does change what an investor should expect from forward returns. The combination of high concentration in a few stocks and a richer-than-usual price multiple is the part of the picture that should make a beginner pause before treating QQQ as a "set it and forget it" investment.
Nasdaq 100 vs S&P 500: which index fits your goals
"Which is better, Nasdaq 100 or S&P 500?" is the wrong question to ask, really. A better one: which sector bet do you actually want to make? The S&P 500 sits across all eleven major sectors. That includes the financials the Nasdaq 100 deliberately leaves out. The 100, by contrast, is mostly information technology plus communication services, with a chunk of consumer discretionary mixed in. Healthcare and industrials get smaller positions. Volatility tells the same story. A Nasdaq analytics paper documents that NDX has consistently posted higher annualized vol than SPX, year after year. The gap added up. Across the past two decades, NDX beat the S&P 500 by roughly 199 cumulative percentage points. That performance gap, of course, was paid for by the deeper drawdowns we already walked through.
The two benchmarks also overlap more than people realize. Most of the top Nasdaq 100 components sit inside the S&P 500 too, so owning both is closer to doubling down on the same names than truly diversifying. The Dow Jones Industrial Average is another comparison point often raised, although it is price-weighted and only covers 30 stocks, so it answers a different question entirely. If your time horizon is decades and you can sleep through a 50% loss, the Nasdaq 100 has historically been a more rewarding stock market position. If you cannot, the S&P 500 is closer to what most people imagine when they say "the market."

How to invest in the Nasdaq 100 (QQQ and the alternatives)
Most retail investors get Nasdaq 100 exposure through one ticker: QQQ. The Invesco QQQ Trust holds about $472.6 billion in assets. Invesco is its parent company. The expense ratio sits at 0.18%, trimmed down from 0.20% in late 2025. QQQ also happens to be the second most actively traded ETF in the United States, which buys you tight bid-ask spreads and a real-time quote that hugs the underlying Nasdaq-100 through every trading hour. Useful if you trade often. Less useful if you plan to hold for ten or fifteen years.
For the long-term buy-and-hold investor, the smarter pick is usually QQQM, Invesco's sibling fund. Same index. 0.15% expense ratio instead of 0.18%. Three basis points sounds like rounding noise, and on any single year it pretty much is. Run that gap forward twenty years on a six-figure position, though, and the math stops looking trivial.
Then there are the leveraged products. ProShares UltraPro QQQ — ticker TQQQ — promises three times the daily move at an 0.88% expense ratio. Sounds appealing. Right up until you watch what it does in a choppy market, where the daily reset chews into the position from both directions. Decay. Not a holding for next year, definitely not for next decade. An equal-weighted version called QQQE exists for people who want Nasdaq 100 components without that top-heavy concentration. The most active traders can also reach for Nasdaq 100 futures (ticker NQ), or options on QQQ, to hedge or to bet directionally. Those open up a different conversation entirely. For the typical beginner the cheapest correct tool is QQQM. The fanciest one — TQQQ — is almost always the wrong one.
What every Nasdaq 100 investor should remember
Treat the Nasdaq 100 as a powerful but specific tool. The long-term returns it has produced since 1985 are real. So is the price of admission: a concentrated bet on a small handful of large technology firms, plus drawdowns deep enough to test almost anyone holding it. Own it on purpose. Size it to a risk you can actually hold. Read the December rebalance press releases when they come out; they are short, and they will tell you what the index is becoming.