Crypto bubble: a deep dive into every major crash, what caused them, and what the cycles actually tell us
I bought Bitcoin for the first time in November 2021. The price was somewhere around $58,000. By June 2022 I was staring at $18,000 and wondering if "generational wealth opportunity" was the most expensive phrase in the English language. That was my introduction to what a crypto bubble feels like from the inside.
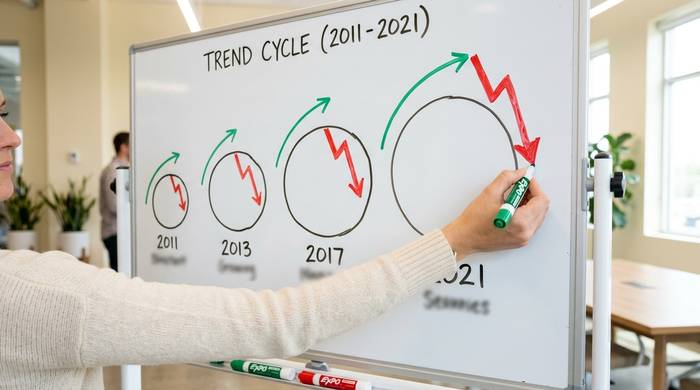
But here is the thing I did not understand at the time: what happened to me was not new. It was the fourth time this exact pattern had played out in Bitcoin's history. The prices were different. The narratives were different. But the shape of the cycle, the euphoria followed by the crash followed by people swearing they would never buy crypto again, that was identical to 2011, 2013, and 2017.
This article goes through every major crypto bubble in order, breaks down what caused each one, looks at the warning signs that were visible in hindsight, and addresses the question that matters most in 2026: are we in a bubble right now?
What makes a crypto bubble different from a normal market correction
People use "correction" and "bubble" like they mean the same thing. They do not. A correction is a 10-20% dip that lasts a few weeks and then recovers. That is normal. That is healthy. A bubble is when prices leave the planet, float around in the stratosphere for a while, and then slam back to earth hard enough to wipe out 80% of the value. Crypto does the second one. Regularly.
An economist named Hyman Minsky mapped out how bubbles form, and I swear he was writing about crypto before crypto existed:
| Stage | What happens | Crypto example |
|---|---|---|
| Displacement | A new technology or narrative captures attention | "Bitcoin is digital gold" (2020) |
| Boom | Early adopters buy in, price starts rising, media covers it | BTC goes from $10K to $30K |
| Euphoria | Everyone is buying, prices are irrational, warnings are ignored | BTC hits $69K, meme coins explode |
| Profit-taking | Smart money starts selling quietly | Institutional rebalancing, whale outflows |
| Panic | Everyone sells at once, price collapses | BTC drops to $16K, Terra/Luna implodes |
In the stock market, a 30% crash is a big deal. In crypto, 80% crashes have happened four times and each time the market recovered and made new highs. That is not normal for any asset class. And it is why the "is this a bubble?" question carries more weight here than anywhere else.
The 2011 bubble: Bitcoin's first crash
Most people do not know that Bitcoin's first bubble happened in 2011. Bitcoin went from $0.30 in early 2011 to $31.50 on June 8. The trigger? A Gawker article about the Silk Road darknet marketplace brought Bitcoin into public consciousness for the first time. New buyers flooded in.
Then it crashed. By November 2011, Bitcoin was at $2.01. A 93.6% drawdown. The entire market cap was under $200 million. The price ran far ahead of any realistic adoption curve, and then gravity did what gravity does.
The cause of the crash was equally straightforward: the Mt. Gox exchange was hacked. User confidence collapsed. And the market simply was not big enough to absorb any significant selling pressure.
The 2013-2014 bubble: the first "mainstream" crypto crash
This was actually a double-bubble year. Bitcoin first surged to $266 in April 2013, crashed to $50, then climbed again to $1,127 by November 29. Chinese retail speculation was the main driver: Baidu started accepting BTC, and the Cyprus banking crisis gave Bitcoin its first "safe haven" narrative.
Then China's central bank said no. Financial institutions banned from touching Bitcoin. And in February 2014, Mt. Gox, the exchange where most of the world's Bitcoin traded, announced that 850,000 BTC were gone. Stolen. $450 million at the time. The exchange shut down. By January 2015, Bitcoin sat at $172. An 84.7% drop from peak.
Here is the thing that I wish I could travel back in time and tell myself: the people who bought BTC at $172 in January 2015 and held until December 2017 made over 100x their money. And the people who bought at $1,127 in November 2013 and panic-sold at $200 lost everything. Same asset. Different timing. Different outcomes.
The 2017-2018 ICO bubble: the one everyone remembers
If you were around for crypto in 2017, you remember the energy. Bitcoin went from about $1,000 in January to nearly $20,000 in December. Ethereum went from $8 to $1,400. And thousands of Initial Coin Offerings (ICOs) raised billions of dollars for projects that often amounted to a whitepaper and a dream.
What made 2017 different: it was not just Bitcoin anymore. Over $6 billion poured into ICOs, most of which had nothing but a whitepaper and a Telegram group. I remember looking at projects that promised to put dental records on the blockchain. Fishing supply chains on the blockchain. Everything on the blockchain. Total crypto market cap hit $830 billion in January 2018.
Then it fell apart in a way that traumatized an entire generation of crypto investors. Bitcoin: $19,783 to $3,122. That is 84%. Ethereum went from $1,400 to $85. Ninety-four percent. Most ICO tokens dropped 95-99% and never came back. The SEC started sending letters. The party was definitively over.
| Bubble | Peak price (BTC) | Bottom price | Drawdown | Time to recover |
|---|---|---|---|---|
| 2011 | $32 | $2 | 94% | ~2 years |
| 2013-2014 | $1,150 | $200 | 83% | ~3 years |
| 2017-2018 | $19,783 | $3,200 | 84% | ~3 years |
| 2021-2022 | $68,789 | $15,476 | 77.5% | ~2 years |
The 2021-2022 crash: the bubble with a body count
This one hurt different because real people with real money were involved at a scale the previous crashes never reached.
November 10, 2021. Bitcoin: $68,789. Total crypto market cap: $3 trillion. BlackRock and Fidelity were building crypto products. Tesla had $1.5 billion in BTC. Larry David and Matt Damon were doing Super Bowl ads telling everyone to be brave and buy crypto.
The Fed started raising rates in March 2022. That alone would have been bad enough. But then May happened. Two large addresses pulled 375 million UST out of Anchor Protocol (a DeFi platform paying 20% yield on the Terra stablecoin). UST lost its dollar peg. The mechanism designed to restore it required minting new LUNA tokens, but mass redemptions hyperinflated LUNA's supply from 350 million to 6.5 trillion in days. LUNA went from $80 to zero. $40 billion vanished in a week.
Terra/Luna's implosion triggered a cascade that reads like a financial horror story. Three Arrows Capital, a Singapore-based hedge fund with massive leveraged exposure to LUNA, failed margin calls and was liquidated in June 2022. Total claims: $2.8 billion. Celsius Network, which had loaned $75 million to 3AC, froze withdrawals on June 12 and filed for bankruptcy in July, owing $4.7 billion to 600,000 customers. Voyager Digital, which had loaned $665 million to 3AC, filed for bankruptcy five days later with over 100,000 creditors.
And then came November. CoinDesk revealed that FTX's sister trading firm Alameda Research held $5 billion in FTT tokens. Binance CEO CZ announced he would sell his $529 million in FTT. FTX users rushed to withdraw. On November 11, FTX filed for bankruptcy. $8.7 billion in customer funds had been misappropriated. Over 1 million creditors were affected. Sam Bankman-Fried was later convicted of fraud and sentenced to 25 years in prison.
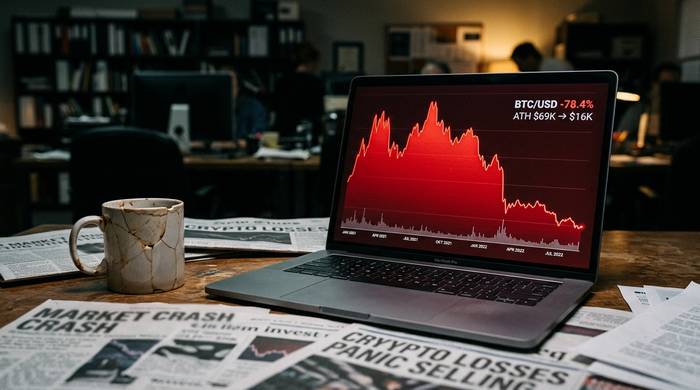
By November 2022, Bitcoin had bottomed at $15,476. The total crypto market cap had dropped from $3 trillion to under $800 billion. And millions of retail investors had learned the same lesson I learned: that "this time is different" is always wrong.
The halving cycle theory: pattern or coincidence?
I keep coming back to this question because the data is weird enough to be interesting.
Every four years, Bitcoin's mining reward gets cut in half. Fewer new coins enter circulation. In theory, reduced supply with stable or growing demand should push prices up. The halvings happened in 2012, 2016, 2020, and 2024. Every single time, within 12 to 18 months of the halving, Bitcoin hit a new all-time high. And every single time, it crashed afterward.
A guy named PlanB built a model around this called Stock-to-Flow. He predicted $100K Bitcoin by end of 2021. It hit $69K and then collapsed. So the model was wrong on the number but right on the direction. PlanB says it is "not perfect." Critics say it is broken. The truth is probably that the four-year pattern is real but getting weaker with each cycle. The drawdowns are getting shallower (93.6%, 84.7%, 84.2%, 77.5%), which suggests the market is maturing even as the cycle persists.
Is the halving cycle a fundamental supply dynamic, or is it a story that traders believe hard enough to make real? I genuinely do not know. Four data points is not enough to prove a pattern. But it is enough to make me pay attention every time a halving approaches.
Warning signs: how to spot a crypto bubble before it pops
Here is what kills me. Every single bubble had warning signs that were obvious afterward and invisible at the time. I fell for it in 2021. Millions of other people fell for it. And yet the warning signs were the same ones that had appeared in 2017, 2013, and 2011.
The Mayer Multiple compares Bitcoin's price to its 200-day moving average. When it goes above 2.4, the market is historically overheated. It hit 2.6 before the 2017 crash and 2.1 before the 2021 peak.
The Fear and Greed Index measures market sentiment on a scale of 0 (extreme fear) to 100 (extreme greed). Readings above 80 have preceded every major top. The index hit 95 in November 2021.
Exchange inflows spike before crashes as investors move coins to exchanges to sell. On-chain data from Glassnode and CryptoQuant tracks this in real time.
Leverage ratios in the futures market tell you how much borrowed money is in the system. High leverage means the market is fragile. A small downturn triggers cascading liquidations that amplify the crash.
And the most reliable signal of all: when your Uber driver starts giving you altcoin tips, the top is probably in.
Is crypto in a bubble right now? The 2026 question
Nobody who is honest can answer this question with certainty. Anyone who says they can is trying to sell you something.
What I can tell you is what the data shows. Bitcoin spot ETFs got approved in January 2024 and pulled in hundreds of billions in institutional money. BTC crossed $100,000. Total market cap is back above $3 trillion. This is not Reddit retail money anymore. BlackRock is in. Fidelity is in. The US passed pro-crypto legislation. This is different from 2021 in meaningful structural ways.
But when I run through my checklist, the bubble indicators are not screaming yet. Mayer Multiple below 2.4. Exchange inflows flat. Leverage ratios lower than 2021. Nobody is taking out mortgages to buy Dogecoin. At least not that I have seen this week.
Does that mean we are safe? No. It means the dashboard is green right now. The dot-com era looked green too. Amazon was a real company with real revenue, and it still dropped 93% in the crash. Real companies survived the dot-com bubble. Fake ones did not. The same split exists in crypto right now: Bitcoin ETFs sit next to meme coins worth billions with no utility whatsoever.
My honest take: the fundamentals are stronger than they were in 2021. Institutional money is a stabilizing force. The regulatory picture is clearer. Bitcoin is in the S&P 500 conversations now, not just the Reddit forums.
But the speculative fringe is still there. Meme coins with no utility still reach billion-dollar valuations. Leverage trading is still accessible to anyone with a phone. And the FOMO machine still runs on the same fuel it always has: the fear that everyone else is getting rich and you are not.
If you are invested in crypto in 2026, the smart play is the same as it always has been: do not invest more than you can afford to lose completely, take profits when things feel euphoric, and remember that every previous peak felt like it would last forever. The people who survived all four bubbles are the ones who treated crypto as a long-term position, not a get-rich-quick scheme. Four crashes. Four recoveries. The pattern is not a guarantee, but it is the closest thing to a historical lesson this market has to offer.


