WACC: How to Calculate the Weighted Average Cost of Capital

Two analysts value the same company in the same week and come back billions of dollars apart. They agree on the cash flows. They agree on the growth rate. The gap comes from one number — one used a 9% discount rate, the other used 10%. That single percentage point is WACC, and it quietly decides more of a valuation than almost anything else in the model.
WACC, the weighted average cost of capital, is the blended rate a company pays for all the money it uses, both debt and equity. It looks like one clean percentage, but every input behind it is an estimate, and small changes ripple straight into value. By the end of this guide you will be able to calculate WACC from real inputs, plug it into a valuation, and see why analysts argue about it so much.
What the Weighted Average Cost of Capital Is
A company raises money in two main ways. It borrows (debt) and it sells ownership (equity). Each source has a price. Lenders want interest; shareholders want returns. The weighted average cost of capital blends those two prices into a single rate, weighting each by how much of the company's financing it represents.
That blended number is really a hurdle. It is the minimum return the company's investments must earn just to keep every provider of capital satisfied. Clear the hurdle and the business creates value. Fall short and it destroys value, even if the income statement still shows a profit.
This is why WACC sits at the center of so many decisions. It is the rate companies use to evaluate whether a new factory, an acquisition, or a product line is worth funding. It is also the discount rate investors use to translate a company's future cash flows into what they are worth today. Get the costs of capital wrong and every decision built on top of them tilts with it.
The WACC Formula and Its Components
The formula looks busy, but it is just a weighted average:
WACC = (E/V) × Re + (D/V) × Rd × (1 − Tc)
Here E is the market value of equity, D is the market value of debt, and V is the two added together. Re is the cost of equity, Rd is the cost of debt, and Tc is the corporate tax rate. The two fractions, E/V and D/V, are the weights; they always sum to one. The hard part is not the arithmetic. It is estimating the three inputs honestly.
| Symbol | What it means | Where to get it |
|---|---|---|
| E/V, D/V | Equity and debt weights | Market values: share price × shares, plus debt |
| Re | Cost of equity | CAPM: risk-free rate + beta × equity risk premium |
| Rd | Cost of debt | Yield to maturity on the company's debt |
| Tc | Corporate tax rate | Statutory or effective rate (US federal: 21%) |
Cost of equity and the CAPM
Equity has no stated interest rate, so its cost has to be modeled. The standard tool is the capital asset pricing model: Re = Rf + β × (equity risk premium). The risk-free rate Rf is usually the yield on a long government bond. Beta measures how much the stock moves with the market; a beta above one means it swings harder than the index. The equity risk premium is the extra return investors demand for holding stocks over that risk-free bond. Add the premium, scaled by beta, to the risk-free rate, and you have the expected returns equity investors require. Equity costs more than debt for a simple reason: shareholders are paid last, after lenders and the tax authority, so they demand a higher return for carrying more risk.
After-tax cost of debt
Debt is easier, with one twist. The cost of debt is the yield to maturity on what the company owes, the rate it would pay to borrow today. But interest payments are tax-deductible, so borrowing creates a tax shield. To capture it, you multiply the pre-tax rate by (1 − Tc). At the US federal corporate tax rate of 21%, a company paying 5% on its debt has an after-tax cost of debt of just 3.95%. That deduction is a real reason debt looks cheaper than equity.
Weighting by market value, not book
One mistake quietly wrecks WACC calculations: using book values from the balance sheet for the weights. WACC is about what capital costs now, so the weights should reflect current market values. Use the company's market capitalization for equity and the market value of its debt. For a company whose shares have run up for years, book value can understate equity by an order of magnitude, throwing the whole weighting off.
How to Calculate WACC: A Real Apple Example
Most tutorials reach for a made-up company with round numbers. Worse, many use a stale equity risk premium pulled from a textbook. Let's run real, current inputs through the formula instead, using Apple as of mid-2026.
Apple's cost of equity and cost of debt
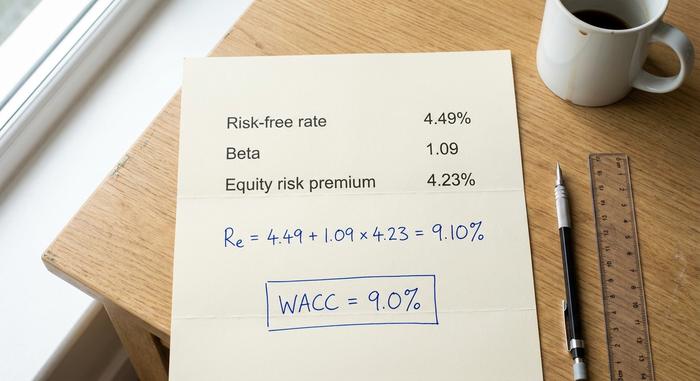
Start with the cost of equity. In June 2026 the 10-year US Treasury yields about 4.49%, a fair proxy for the risk-free rate. Apple's beta sits near 1.09 on a five-year monthly basis, and the implied equity risk premium for the US market is about 4.23%. Plug those in:
Re = 4.49% + 1.09 × 4.23% = 9.10%
Beta is worth a pause. Different data providers report Apple's beta anywhere from 0.83 to 1.09 depending on the window and method, and that range alone can move the cost of equity by half a point. I use the higher, more recent figure here — but the honest takeaway is that this input is a judgment, not a fact. For the cost of debt, Apple borrows cheaply; a pre-tax rate around 3.5% becomes roughly 2.77% after the 21% tax shield.
Putting the pieces together
Now the weights. Apple's equity is worth about $4.60 trillion against roughly $84.7 billion of debt, so equity is about 98% of the capital and debt about 2%. The calculation:
| Input | Value | Source |
|---|---|---|
| Risk-free rate (Rf) | 4.49% | 10-year US Treasury, June 2026 |
| Beta (β) | 1.09 | 5-year monthly |
| Equity risk premium | 4.23% | Implied US ERP, Jan 2026 |
| Cost of equity (Re) | 9.10% | Rf + β × ERP |
| After-tax cost of debt | 2.77% | ~3.5% × (1 − 0.21) |
| Equity weight (E/V) | ~98% | Market cap ÷ total capital |
| Debt weight (D/V) | ~2% | Debt ÷ total capital |
| WACC | ≈ 9.0% | Weighted blend |
WACC = 0.98 × 9.10% + 0.02 × 2.77% ≈ 9.0%. That lines up with independent estimates for Apple and with the broad range for large technology firms. Notice what happened: because Apple is financed almost entirely with equity, the cost of debt barely registers. Beta and the equity risk premium do nearly all the work. For a heavily indebted company, the picture flips. Imagine a firm split evenly between equity costing 10% and after-tax debt costing 4%. Its WACC lands near 7%, dragged down by the cheaper debt, and now a shift in its borrowing rate moves the result as much as its beta does.

Using WACC as the Discount Rate in DCF
Calculating WACC is the setup. Its main job is to serve as the discount rate in a discounted cash flow model, the rate that converts a company's future cash flows into a present value today.
Why WACC is the right discount rate
A discounted cash flow valuation projects the cash a business will generate, then discounts each year back to the present. The question is which rate to discount at. Since those cash flows belong to every provider of capital, debt and equity alike, the discount rate has to reflect what all of them require. That is exactly what WACC is: the blended required return across the whole capital structure. Use a lower rate and future cash looks more valuable; use a higher rate and it shrinks. The rate and the cash flows also have to match: because WACC is an all-investor rate, it belongs with the cash flows available to all investors, not with the slice left for equity holders alone.
Why a 1% change moves valuation so much
This is where the input fuss pays off, or backfires. Because most of a company's value sits in cash flows years out, and because the terminal value often makes up 60% to 80% of a DCF, the discount rate compounds hard. A small move in WACC swings the answer far more than intuition suggests. The table below shows a terminal value on a fixed cash flow growing at 3%, indexed to 100 at an 8% WACC.
| WACC | Relative terminal value (8% = 100) |
|---|---|
| 8% | 100 |
| 9% | 83 |
| 10% | 71 |
| 11% | 63 |
| 12% | 56 |
Move WACC from 8% to 10%, just two percentage points, and the terminal value falls by nearly 30%. Practitioners often find that a single point of WACC shifts an equity valuation by 15% to 25%. That is the whole reason two careful analysts can value one company billions apart while agreeing on everything else.
What Counts as a Good WACC for a Company
People want a single "good" number, and there isn't one. Lower is generally better for the company, because cheaper capital means a lower hurdle and more projects worth funding. But what counts as low depends entirely on the industry, the company's risk, and the interest rate environment. With the risk-free rate near 4.5%, almost no firm will show a WACC of 4%, because equity always demands a premium on top.
Context decides everything. A stable utility funded heavily with cheap debt might sit in the high single digits. A large technology company like Apple lands around 9%, in line with the broad range published for the US technology sector, roughly 9% to 10%. An early-stage, equity-funded venture with a high beta can run well into the teens. Rather than chase a magic figure, it helps to know what pushes the number around.
| Factor | Pushes WACC up | Pushes WACC down |
|---|---|---|
| Business risk (beta) | Higher beta | Lower beta |
| Interest rates | Rising rates | Falling rates |
| Debt level | Very high or very low | A moderate, cheap mix |
| Equity risk premium | Wider premium | Narrower premium |
WACC, ROIC, and Creating Value
A WACC means nothing on its own. It only matters next to the return a company actually earns on its capital. That comparison is where WACC becomes a hurdle rate in practice: any new investment has to clear it to be worth doing, which is why WACC doubles as a project's required rate of return.
Line WACC up against return on invested capital, and the verdict is immediate. If a company earns a return on its invested capital above its WACC, it is creating value with every dollar it deploys. If ROIC sits below WACC, the business is destroying value even while booking accounting profits. The size of the gap is the whole story. A company earning a 15% return on invested capital against a 9% WACC is compounding wealth quickly; one earning 7% against that same 9% is quietly eroding it, no matter how healthy its reported earnings look. The same logic drives economic value added, which is calculated as net operating profit after tax minus WACC multiplied by invested capital. In every one of these tools, WACC is the bar. Beat it and investors are better off; miss it and they would have done better elsewhere.
Common Mistakes and Limits of WACC
WACC is an estimate wearing the costume of a precise number — and its errors are predictable. The most common is using book values from the balance sheet for the weights instead of market values. Close behind are a stale equity risk premium, the wrong beta, and applying one company-wide WACC to projects that carry very different risk. A safe utility upgrade and a speculative new venture should not be discounted at the same rate. WACC also drifts as interest rates move, so a number that was right last year may mislead today. Treat it as a careful range, never a single decimal carved in stone.
The Bottom Line on Calculating WACC
WACC is a range, not a point. It blends the cost of debt and the cost of equity into the single rate a company must beat, and it is only as trustworthy as the estimates feeding it. Because a one-point change can move a valuation by a fifth, the discipline is in the inputs: current market weights, a defensible beta, a fresh risk premium, and a discount rate matched to the actual risk of what you are valuing. So the next time two analysts hand you valuations that are billions apart, check the discount rate first. The disagreement is almost always hiding there.


