Average Net Worth by Age: How You Compare in 2026

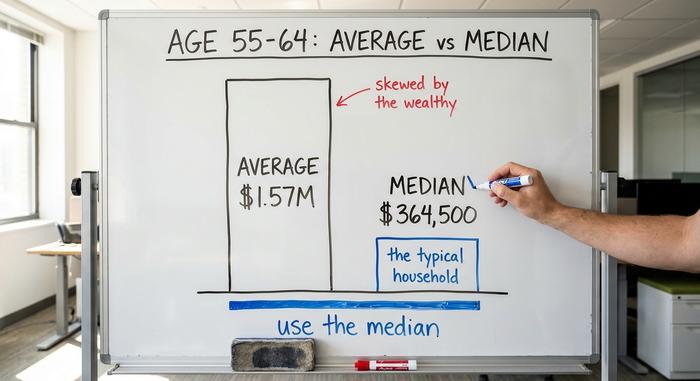
Here is a number that should annoy you. The average American in their late 50s is worth about $1.57 million. Feel behind yet? Don't. The typical person that age is worth $364,500, and both figures come from the exact same Federal Reserve survey. That four-to-one gap, between the "average" and the typical, is the first thing to get straight before you measure yourself against anyone.
So work out which "average" you mean before you size yourself up against it. This guide gives you the real average net worth by age from the Fed, shows why that headline number deceives, and helps you see where you actually stand. Plus the part other guides drop: where crypto fits now. One caveat. The core data is the 2022 Survey of Consumer Finances, the newest there is, with the 2025 edition due late 2026. For crypto, I have used 2025 and 2026 figures and flagged them.
What Counts: Home Equity, Debt, and Crypto
Net worth is simple arithmetic. Everything you own, minus everything you owe. That is the whole formula. The trick is just remembering what belongs in each column.
What you own: the equity in your home, meaning its value minus the mortgage, not the sticker price. Your retirement accounts, a 401(k) or an IRA. Any brokerage holdings, the cash in your bank, and yes, crypto, counted at today's market price. What you owe: the mortgage balance, student loans, the car loan, credit card debt. Subtract the second list from the first. That number is your net worth. Own a $400,000 house with a $250,000 mortgage, a $90,000 401(k), and $5,000 in crypto, then owe $12,000 on cards, and you are worth $233,000. That is the whole exercise.
Two traps catch people here. A big house with a bigger mortgage adds far less than it feels like, because only the equity counts. And crypto goes on the sheet at what it is worth today, not what you paid or what you are praying it hits. Hold it, and it counts, good year or bad.
Worth keeping straight, too: net worth is a snapshot of what you own, while cash flow is the money moving in and out each month. Different questions entirely. And among crypto holders, a stablecoin sitting in a wallet acts like cash, while a volatile token acts like a speculative stock. Both count. They are not the same kind of money.
Average Net Worth by Age: The Real Numbers
Here are the figures everyone is actually searching for, straight from the Federal Reserve.
The full table
The numbers below come from the 2022 Survey of Consumer Finances, published by the Federal Reserve in October 2023. Median means the household right in the middle. Mean is the simple average.
| Age of head of household | Median net worth | Mean net worth |
|---|---|---|
| Under 35 | $39,000 | $183,500 |
| 35-44 | $135,600 | $549,600 |
| 45-54 | $247,200 | $975,800 |
| 55-64 | $364,500 | $1,566,900 |
| 65-74 | $409,900 | $1,794,600 |
| 75+ | $335,600 | $1,624,100 |
Across all US households, the median net worth is $192,900 and the mean is $1,063,700.
What the curve shows
The shape makes sense. Net worth climbs through your working years as you pay down debt and build savings, peaks in the 65-74 bracket at a median of $409,900, then drifts down after 75 as people stop earning and start spending what they saved. Notice too that the youngest group gained the most in percentage terms recently. Median net worth for under-35s jumped 143% between 2019 and 2022, from $16,100 to $39,000, lifted by rising home and stock prices. Big jump, small base. Older cohorts barely moved by comparison, and the dip after 75 is not really decline, it is design: retirees are supposed to spend down what they built. A falling number in your 80s can mean the plan is working.
Median vs Average: Why the Gap Is Huge
If you take one idea from this article, take this one. Average net worth and median net worth tell two different stories, and the average usually lies to you.
Why the mean misleads
A mean is just the total wealth divided by the number of households. Drop a few billionaires into the pool and the average shoots up, even though nobody in the middle got richer. That is exactly what happens with net worth. A small number of very wealthy families, holding most of the stocks and real estate, drag the average far above what a normal household has. At ages 55 to 64, the mean is $1.57 million but the median is $364,500, less than a quarter of it. The "average" describes almost no one.
Which number to actually use
Use the median. It is the household in the exact middle, so it tells you what "typical" really looks like for your age. When a headline brags that the average American is nearly a millionaire, it is technically true and practically useless. Judge yourself against the median for your bracket, and the picture gets honest fast.
A quick way to feel the difference: if ten neighbors each have $50,000 and one has $20 million, the average net worth on the street is about $1.8 million. The median is still $50,000. The average describes the one mansion, not the block you live on.
How Your Net Worth Compares by Age
So, ahead or behind? Compare your net worth by age to the median for your bracket, not the mean. If you are 40 with a net worth above $135,600, you are ahead of half your peers. Below it, you have company, and time.
One forward-looking benchmark helps here. A common rule of thumb suggests building investable assets worth roughly one year of income by 30, three times by 40, six to seven times by 50, and around twenty times by retirement. Treat that as a target to aim at, not a grade on a report card. The medians above describe where people are; the multiples describe where steady saving can take you. Your trend over time matters more than any single snapshot.
It also helps to stay in your own lane. The whole distribution shifts up with each decade, so the bar for "doing well" at 60 is far higher than at 30. Comparing your number to someone in a different age bracket tells you almost nothing. Compare to your peers, and to your past self.
How Crypto Fits the Net Worth of Americans
Here is what the other guides leave out. For a growing share of households, especially younger ones, crypto is now part of the average net worth picture, and that changes how some people build wealth.
Who actually owns crypto
Ownership skews young, sharply. The Federal Reserve's 2022 survey of household economics found about 15% of adults aged 30 to 44 held crypto, against just 3% of those 60 and older. A June 2025 Gallup poll put overall ownership at 14%, with 25% of men aged 18 to 49 owning some, compared with 7% of adults 65 and up. Estimates vary by method: the Fed's broader 2025 well-being survey counted 10% of adults using crypto, while an earlier reading from the same Fed program showed a similar single-digit-to-low-teens range. The honest read is somewhere in the 10% to 15% range for most adults, higher for young men. And the newest trend cuts the other way: older buyers are now the fastest-growing group entering the market. One 2026 industry survey estimated more than 67 million Americans now hold crypto, with the 55-and-older crowd making up 28% of first-time buyers in the past year. Treat that figure with caution, since it came from a crypto trade group, but the direction shows up elsewhere too: adoption is broadening out of its young-male niche.
How much crypto belongs in a net worth
A reality check. Only 4.3% of US households held any crypto in the 2022 data, according to the St. Louis Fed, and for most holders it is a modest slice, not the bulk of their wealth. No government source yet publishes crypto as a share of net worth by age, which tells you how new this still is. My take: count it at market value, treat it as the most volatile line on your balance sheet, and don't let a good year fool you into thinking it is your retirement plan. A position that can fall 70% in a quarter is not a foundation. It is a bet you can afford to lose. For most holders the dollar amounts are still modest anyway. Bank transaction data suggests the typical participant moves less than a week's pay into crypto, meaningful pocket money, not a wealth engine.
How to Build Your Net Worth by Age
The levers barely change with age. The emphasis does.
In your 20s and 30s
Build the foundation. A small emergency fund first, then kill high-interest debt, especially credit cards, because no investment reliably beats a 24% interest rate. Start a retirement account early so compounding has decades to work. The habit underneath all of it is plain: save and invest a steady share of every paycheck, automatically, so the outcome never depends on willpower. This is also where crypto's youth skew shows up: younger investors have the time horizon to take more risk, but "more risk" should still mean a small, deliberate slice, not the whole portfolio.
In your 40s and 50s
These are peak earning years, so the goal is to maximize. Push retirement contributions toward the limit, capture every employer match, and let home equity grow. The table below shows why most people need to push harder here. These are 401(k) balances by age, and the gap between average and median is the same skew all over again.
| Age | Average 401(k) | Median 401(k) |
|---|---|---|
| 25-34 | $42,640 | $16,255 |
| 35-44 | $103,552 | $39,958 |
| 45-54 | $188,643 | $67,796 |
| 55-64 | $271,320 | $95,642 |
Figures from Vanguard's "How America Saves 2025," reported by Bankrate. The median 55-64 balance of $95,642 is sobering next to the net-worth medians, and it is why home equity does so much heavy lifting in American wealth. If the typical saver is this far behind, the fix is rarely exotic. It is the contribution rate. Raising what you set aside by even a few percent of salary, and capturing the full employer match, moves the needle far more than chasing a hot investment ever will. If the trade-offs feel overwhelming, a fee-only financial advisor can be worth the cost at this stage, when the dollars are largest and the mistakes are most expensive.
In your 60s and beyond
Shift from building to protecting. De-risk gradually, plan the drawdown so your money lasts, and trim volatile holdings, crypto included, as your earning years end and your time to recover shrinks. The priorities flip here. In your 20s the goal is growth and time in the market; in your 60s it is sequence-of-returns risk, the danger of a crash landing right as you start withdrawing. A volatile slice that was fine at 30 can sink a retirement at 68.

What Is a Good Average Net Worth by Age?
"Good" is simpler than the comparison charts make it look. Sit at or above the median for your age, keep the line trending up year over year, fund the financial goals that actually matter to you, and do not lean on debt you cannot service. Clear the median for your bracket and you are already ahead of half the country your age.
But the median is a floor, not a finish line. Picture two 35-year-olds, both sitting at $135,600. One is climbing, one is sliding. Same number, opposite stories. Direction beats level, every time. Net worth is a scoreboard for your money habits, not a verdict on you as a person, and the only fair scoreboard compares you to last year's self. Negative right now? You are not failing. Half the 28-year-olds with student loans and a new mortgage are below zero. The only question that counts is which way the line is bending.
The Number That Actually Matters
One last time, because it is the whole game: use the median, not the mean. At 55 to 64 that means $364,500, not $1.57 million. Check your own number against the median for your age, once or twice a year. Watch the direction, not the snapshot. Keep crypto to a slice you could lose without losing sleep. Then stop measuring yourself against some billionaire-inflated average net worth by age, and start asking the one question that pays off: is the number bigger than it was last year?