VOO Stock 2026: Why Boring Is Still Winning at 0.03%

Vanguard's S&P 500 ETF — the VOO stock most index investors hold at the core of a long-term portfolio — costs three cents per hundred dollars per year. Eighty-four percent of US large-cap active managers cannot beat its benchmark over ten years, and the figure climbs above ninety percent at the twenty-year horizon. The math has not changed; only the marketing around it has. While headlines keep pulling retail attention toward AI single-stock bets, failed SPAC ramps, and crypto cycles, VOO has quietly grown into a fund larger than the GDP of most countries by doing one thing well: buying the index and getting out of the way. This guide walks through what VOO actually is, how its price and performance compounded into a $1 trillion combined share class, why VOO sits in a three-way race against SPY and IVV that matters for cost-conscious investors, what changed in 2023 when Vanguard's tax-efficiency patent expired, and where the real risk inside the fund actually lives.
What VOO is and how the Vanguard fund works
Start with the structure. VOO is the ETF share class of the Vanguard 500 Index Fund, the original 1976 Bogle creation that gave US retail investors index access for the first time. The ETF wrapper was added on September 7, 2010. The ticker trades on NYSE Arca. Under the hood, the fund uses full replication: it holds all 500 S&P 500 constituents in their float-adjusted market-cap weights, not a sampling shortcut.
Legally, this is an open-end ETF qualified as a regulated investment company under the Internal Revenue Code. That phrasing matters because the tax behaviour discussed later depends on that RIC qualification. The Equity Index Group at Vanguard has run the strategy since 1976. Manager turnover is unusually low for the industry. Combined share-class AUM (mutual fund plus ETF) crossed $1 trillion in 2024. The ETF class alone held $973.4 billion on May 27, 2026, putting VOO in the top three largest individual ETFs in the world.
VOO stock price and performance 2024–2026
Read the VOO chart like a long-running compounder. Not a trading instrument. NAV on May 27, 2026: $689.96. 52-week range: $536.16 to $691.51. The since-inception annualized return through March 31, 2026 was +14.24% per Vanguard's factsheet, which is comfortably above the ten-percent long-run S&P 500 average. The 2024 calendar return for the index was +25.0%, and VOO tracked it inside a couple of basis points. Then Q1 2026 hit. A –4.34% YTD pullback through March 31 drove every "bear market reset" headline you saw in April. By late May, the trailing twelve-month return — including the trough and the recovery — was +31.15%. Here is the number worth holding onto. A $1,000 investment in VOO ten years ago, with dividends reinvested, is worth roughly $3,800 today.
VOO vs SPY vs IVV: the S&P 500 ETF three-horse race
The three big S&P 500 ETFs cover the same index. The differences sit in cost, structure, and use case, not in what they track. The table below is the cleanest summary available.
| Metric | VOO (Vanguard) | SPY (State Street) | IVV (iShares) |
|---|---|---|---|
| Issuer | Vanguard | State Street | BlackRock |
| Inception | Sep 7, 2010 | Jan 22, 1993 | May 15, 2000 |
| Expense ratio | 0.03% | 0.0945% | 0.03% |
| Structure | Open-end ETF (dual-class) | Unit Investment Trust | Open-end ETF |
| AUM (May 2026) | $973B ETF class | $560B+ | $570B+ |
| Avg daily volume | 5–7M shares | 70–80M shares | 4–5M shares |
| Options depth | Moderate | Deepest in equity ETFs | Modest |
| Tax efficiency | High (heartbeat trades) | Modest (UIT limits) | High (heartbeat trades) |
Three points do the real analytical work here. Cost first. SPY at 0.0945% versus VOO at 0.03% costs you an extra $64 per $100,000 each year. Small. Boring. Over thirty years on a $100,000 starting position, that translates into roughly $1,900 of cumulative fee drag before any reinvestment effects, and several times that once you let the saved dollars themselves compound inside VOO. So: small, but only at first glance.
Structure next. SPY was set up in 1993 as a Unit Investment Trust, which was the simplest fund wrapper the SEC had at the time. UIT rules block securities lending. They also force dividends into cash between distribution dates instead of letting them get reinvested immediately. Both quirks impose tiny frictional drags on tracking. VOO and IVV, on the other hand, are open-end ETFs that can lend securities (a small but real revenue line) and reinvest dividends the day they arrive. The combined effect shows up consistently in five-year tracking-error data.
Use case last. SPY still wins on volume. An $80 million share daily turn produces a bid-ask spread no other equity ETF in the world can quite match, and the options chain on SPY is unmatched. That matters for institutions and short-dated options traders. For a buy-and-hold retail investor with no need for either, VOO and IVV are essentially interchangeable on cost, and both come in slightly cheaper than SPY on fee.
Vanguard's expired patent and what changed in 2023
Most VOO write-ups skip this point. It is the part that matters for the next ten years of the fund's competitive position.
From 2010 through 2023, Vanguard held a US patent on the dual-class mutual fund and ETF share structure that enabled "heartbeat trades": large in-kind transactions that flush appreciated securities out of the fund without realising capital gains for shareholders. The mechanism is dry but powerful. It is the reason VOO has paid almost no capital-gains distributions across its public life, while SPY's UIT structure has had to distribute small amounts of realised gains every few years. In a taxable brokerage account, the difference compounds.
The patent expired in 2023. Vanguard's exclusive use of the technique ended. As of late 2025, several large competitors, including Fidelity, Dimensional Fund Advisors, and JPMorgan Asset Management, had filed for SEC exemptive relief to replicate the same dual-class structure on their own products. CNBC characterised the development in March 2025 as a potential industry game changer, and Morningstar coverage flagged the same transaction mechanism as the centrepiece of any honest analysis of long-term ETF tax efficiency. The implication for VOO is narrower than the headline suggested. Vanguard's first-mover scale, brand, and direct-to-investor channel did not expire with the patent. But the tax-efficiency moat that distinguished VOO from SPY and from most non-Vanguard competitors will erode over the next three to five years as rival ETFs replicate the structure. Fidelity has already pushed expense ratios on selected total-market funds to zero. VOO's 0.03% is still best-in-class for an S&P 500 ETF, but it is no longer untouchable, and the long-term moat is shallower than it was in 2020.
The SPIVA verdict: why active management keeps losing
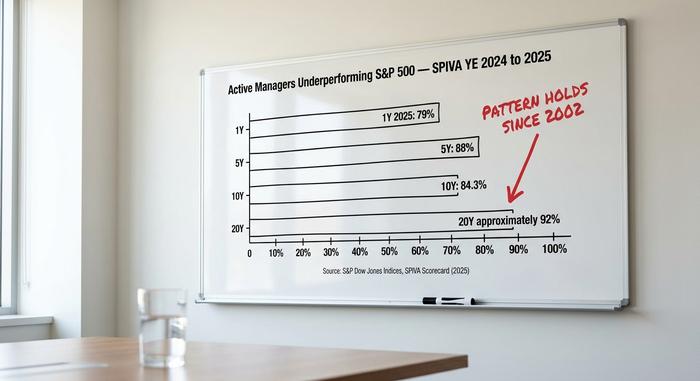
The most uncomfortable number for the active-management industry is published twice a year by S&P Dow Jones Indices in the SPIVA scorecard. The 2024 and 2025 reports show the pattern that has held since 2002.
| Horizon | % of US large-cap active managers underperforming S&P 500 |
|---|---|
| 1 year (2025) | 79% |
| 5 years | 88% |
| 10 years | 84.3% |
| 20 years | ~92% |
The mechanism is straightforward. The industry-average expense ratio for an active US equity mutual fund sits around one percent. VOO's expense ratio is 0.03%. To match the index after fees, an active manager has to gross 97 basis points over the benchmark before retail dollars see parity. To beat it, they need more. Over a ten-year horizon, that compounds into a structural performance hurdle of roughly ten percentage points that the manager has to clear with skill before the investor sees any alpha. The SPIVA data says most managers do not clear it.
The same SPIVA pattern repeats across nearly every fund category and supports the broader argument that low-cost index funds beat active management on a net-of-fees, multi-year horizon. Retail investors compound that mathematical disadvantage with timing errors. Morningstar's 2024 "Mind the Gap" study found the average dollar-weighted return for US equity-fund investors trails the time-weighted fund return by roughly 1.7 percentage points annually, because money flows in after rallies and out after drawdowns. In a passive index ETF held inside a DRIP, that gap shrinks toward zero.
The 2026 case for boring is unusually strong. Two years of AI single-stock concentration trades, failed SPAC stories like QuantumScape and Lucid, and crypto-cycle volatility have rewarded narrow speculative trades in the headlines while broad index returns kept arriving without fanfare. The S&P 500 calendar return for 2024 was +25.0% versus +11.5% for the Russell 2000. Most of that gap was Magnificent 7 mega-cap performance, and the VOO portfolio captured it by definition. The target index always captures the gain, while active sector or factor tilts away from market-cap weighting kept many funds out of the winners.
The Magnificent 7 concentration risk inside VOO stock
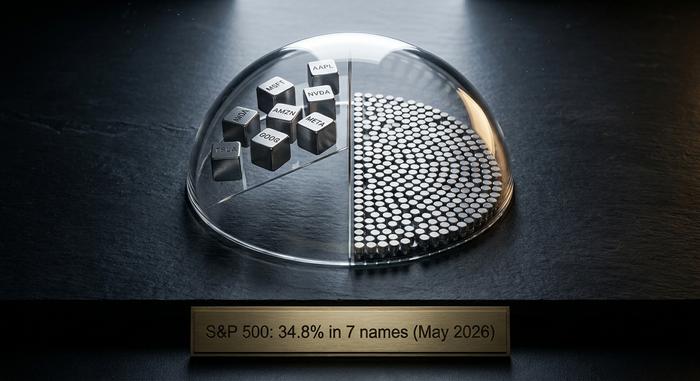
The honest counterargument to the bull case lives inside the holdings table. The Magnificent 7 — Apple, Microsoft, Nvidia, Amazon, Meta, Alphabet, and Tesla — represent 34.8% of the S&P 500's market capitalisation as of May 2026, up from 12.5% in 2016. VOO's top-10 holdings together total 38.37% of fund assets. The Technology sector weighting alone sits at 33.14%.
A "diversified S&P 500 index fund" sounds like reassurance, and at a constituent count of 500 the statement is technically accurate. I am not convinced it is functionally accurate any more. It is no longer the diversification picture most retail investors imagine when they hear "I own the whole market". A VOO investor in 2026 is making a meaningful artificial-intelligence narrative bet through the seven mega-cap holdings whether they understand the position or not. If the AI capex cycle de-rates broadly, the index drops with it, and VOO drops with the index. The risk is not new — index concentration has cycled before, around the Nifty Fifty in the 1970s and the dot-com names in 1999 — but it is real, and it is the reason a sophisticated allocator typically pairs an S&P 500 core with an equal-weight or small-cap satellite.
Dividends, distributions, and tax mechanics
The yield is small. About 1.3% trailing-twelve-month as of May 2026, paid out in quarterly chunks of roughly $2.00 per share in March, June, September and December. DRIP works at every major broker, so the dividends compound back into more shares automatically. The reason VOO has essentially never paid a meaningful capital-gains distribution since launch sits inside the heartbeat trade structure described earlier. For a taxable brokerage account, that no-cap-gains record is doing more of the compounding work than the dividend yield itself. Roth IRAs, traditional IRAs, and 401(k)s do not care about cap-gains drag, but they still benefit from the 0.03% expense versus a target-date fund's 0.50% or a typical actively managed equity fund at 1%.
How to buy VOO and the practical mechanics
Buying VOO is not hard. The ticker trades on NYSE Arca. Every major US broker carries it: Fidelity, Schwab, Robinhood, IBKR, Webull, plus Vanguard's own platform if you want to skip a layer. Most of these support fractional shares, so a beginner can put in a dollar and own a sliver of all 500 names. The fund is eligible for an IRA, Roth IRA, 401(k) brokerage window, 529 plan, or a plain taxable account. Commissions on US-listed ETFs at every major broker have been zero since 2019, so there is no execution drag to think about either.
What VOO at $690 is actually pricing
At $690, VOO stock is not pricing a single company. It is pricing 500 companies, weighted toward seven of them. The bull case for the next decade is the same as the bull case for the prior decade: 0.03% costs, near-zero tax drag, and a benchmark that most active managers continue to fail to beat over any reasonable horizon. The bear case is no longer "passive will underperform"; it is "the benchmark itself is now an AI-concentration trade in disguise". Those are different arguments, and they require different portfolio responses. The honest question is whether the investor pairing VOO with a small equal-weight (RSP), international developed (VEA), or small-cap (VB) satellite is making a better risk-adjusted trade than the investor who buys VOO alone. The SPIVA data is unambiguous on the comparison: either path beats stockpicking over a ten-year horizon, and either path beats moving cash in and out around the headlines.