APY vs Interest Rate: Difference, Formula, and 2026 Rates
Short version. APY shows what you actually earn. The interest rate is the headline. They sit a few decimal points apart, but those decimals compound, and over decades they decide whether a retirement account is comfortable or a mortgage is brutal. That gap is exactly why the Truth in Savings Act forces every U.S. bank to publish an APY number. Most savers still glance at the wrong one.
So where does APY actually come from? How does it differ from APR and the simple interest rate quoted on a loan? What do the 2026 numbers look like across U.S. banks, CDs, and DeFi pools? And how did the same compounding math help build the disclosure rules at the Federal Reserve and, separately, blow up roughly $50 billion of value when an algorithmic stablecoin called UST went under in three days? That is what this piece is for.
What Is APY and What Is the Interest Rate?
The interest rate, in the strict sense banks use it, is the base annual percentage paid on money in a deposit account before any compounding. It is the simple lever. If a bank quotes a 4.00% interest rate and pays you once at the end of the year on a $10,000 balance, you receive $400.
APY (Annual Percentage Yield) is the same product seen through the lens of compound interest. It tells you what your account actually earns over twelve months once interest is paid more often than once a year and starts to earn interest of its own. The simple interest rate stops at the headline. APY shows the rest.
Federal law requires the second number on every U.S. deposit account. Under the Truth in Savings Act of 1991, codified as Regulation DD (12 CFR Part 1030, enforced by the CFPB), banks must disclose APY using the formula in Appendix A. Credit unions follow the parallel NCUA Part 707. The point of the rule is consumer protection. Without a standardised yield disclosure, banks could quote different nominal rates and different compounding schedules and make apples-to-oranges comparison impossible. APY pulls everything onto one ruler.

The Difference Between APY and Interest Rate
The clearest way to see the difference between APY and interest rate is to put both on the same product.
A bank advertises a savings account at 4.00% interest, compounded monthly. The interest rate is 4.00%. The APY is 4.07%. That 0.07 percentage point gap is the work compound interest does on the balance. Each month, the small chunk of interest earned gets added to the balance, and next month's interest is calculated on the new (slightly larger) balance. Over a year, the effect builds.
Three rules follow from this:
- APY is always equal to or greater than the stated interest rate. Equal only when interest is paid exactly once at year-end.
- The more frequent the compounding, the bigger the gap between APY and interest rate.
- Two accounts with the same headline rate can have meaningfully different APYs if their compounding schedules differ.
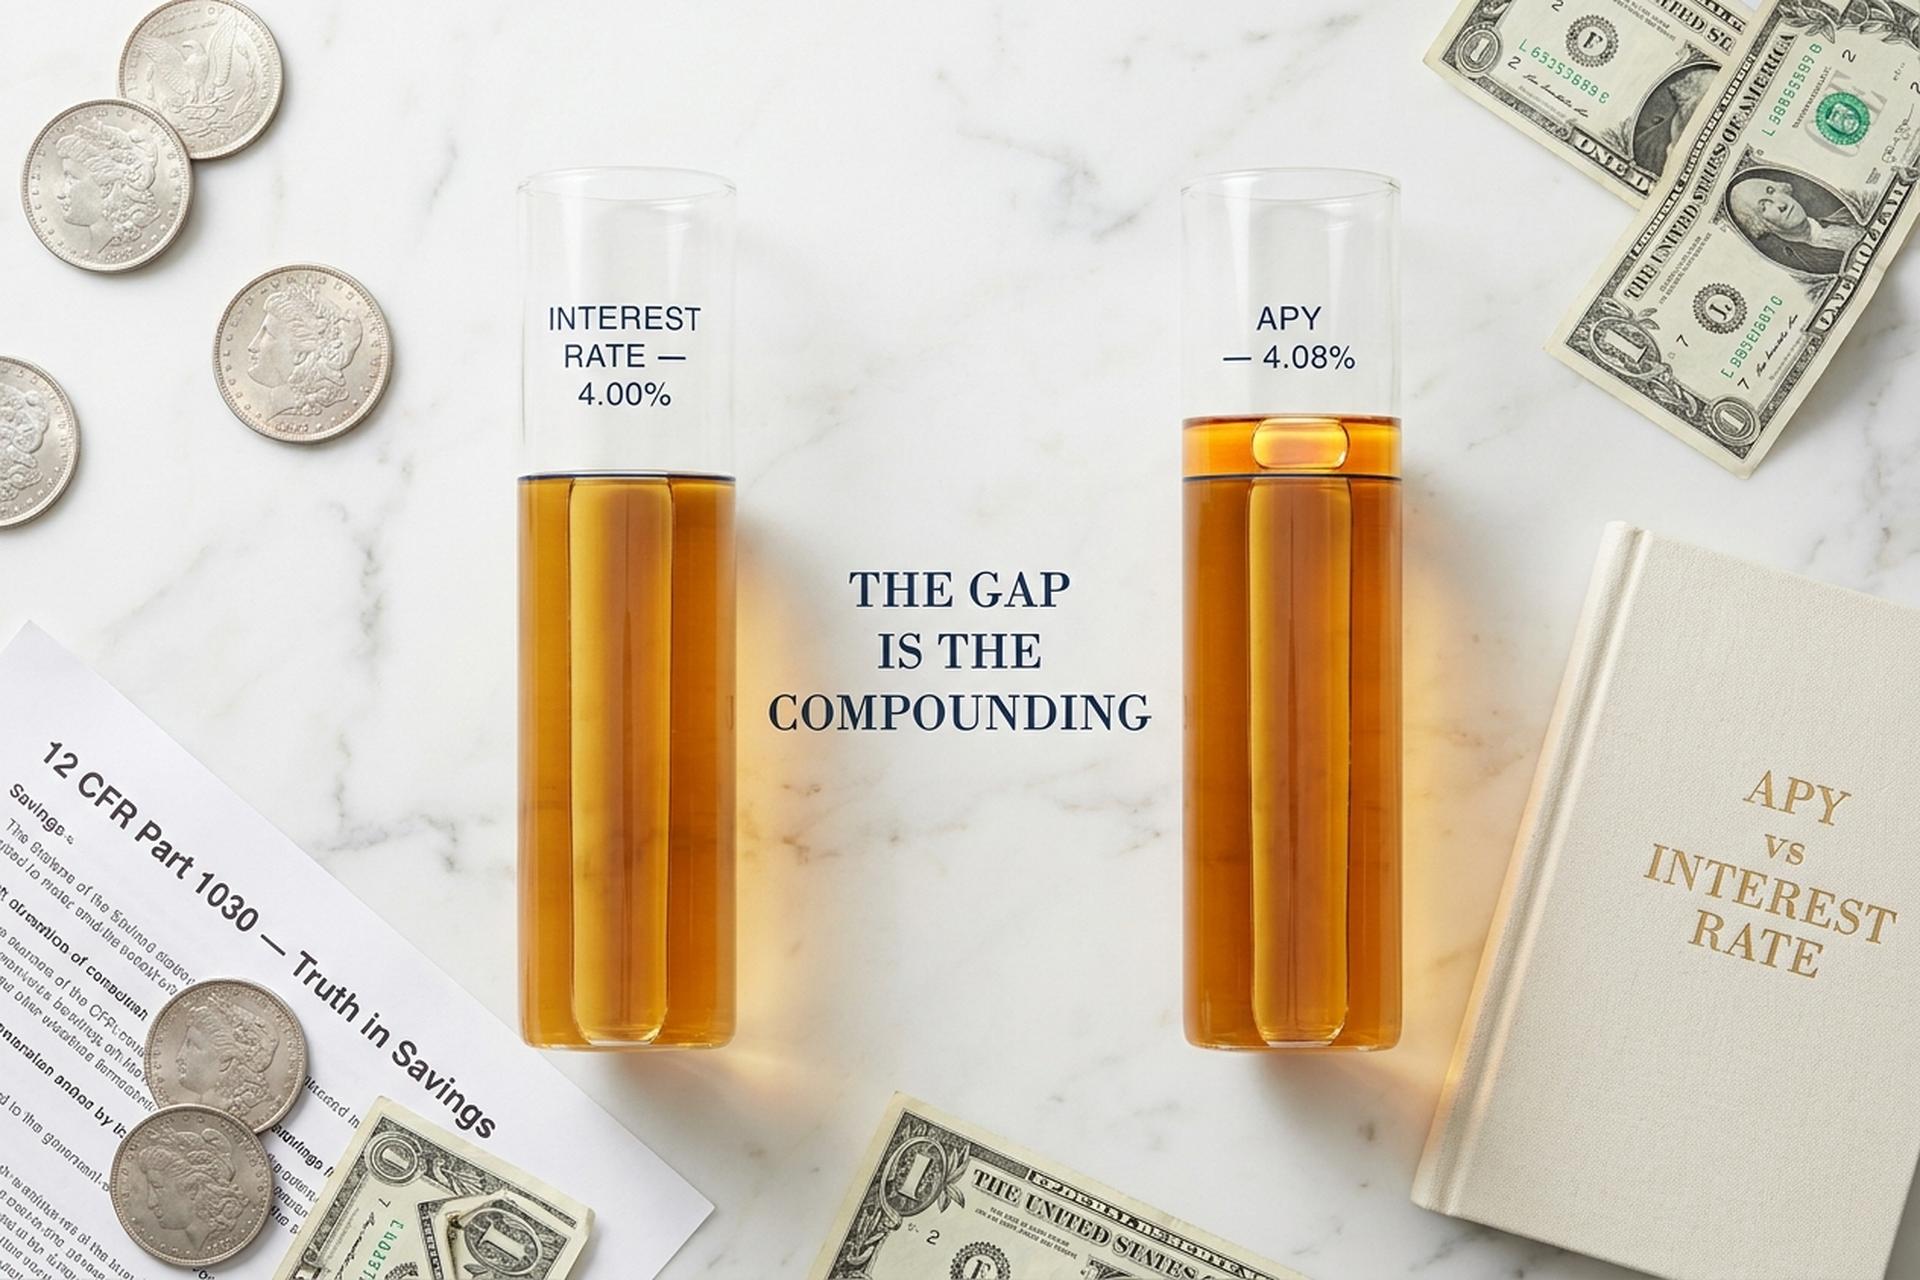
That last point is where consumers most often get caught. A 4.00% interest rate compounded daily produces a 4.08% APY; the same 4.00% compounded annually produces exactly 4.00%. The difference looks tiny on a quarterly statement and grows visible over years.
The APY Formula Behind Every Savings Account
There is one formula. Regulation DD's Appendix A spells it out, and every major bank's calculator runs the same line of math underneath:
APY = (1 + r/n)^n − 1
Two variables. r is the nominal annual interest rate, written as a decimal. n is how many times interest compounds in a year.
Run a 4.00% rate through the formula with daily compounding, so n = 365:
1. APY = (1 + 0.04/365)^365 − 1
2. APY = (1.0001096)^365 − 1
3. APY = 1.04081 − 1
4. APY = 0.04081, which is 4.08%
That is one row of the table. Now do it again at 5.00%, the level several top high-yield savings accounts touched in 2024 before the Fed started cutting:
- Daily compounding (n = 365): APY = 5.13%
- Monthly (n = 12): APY = 5.12%
- Quarterly (n = 4): APY = 5.09%
- Annual (n = 1): APY = 5.00%
So how much money is that, really? On $10,000 in year one, the daily-vs-annual gap comes out to thirteen dollars. Over ten years it climbs to roughly two hundred. Real money. Less dramatic than people sometimes claim, more than nothing.
Advertised APY vs Stated Interest Rate Examples
A useful way to translate the formula into a savings decision is to look at the actual dollar outcomes side by side.
| Compounding frequency | Stated interest rate | Resulting APY | $10,000 after 1 year | $10,000 after 10 years |
|---|---|---|---|---|
| Annual | 5.00% | 5.00% | $10,500.00 | $16,288.95 |
| Quarterly | 5.00% | 5.09% | $10,509.45 | $16,436.19 |
| Monthly | 5.00% | 5.12% | $10,511.62 | $16,470.09 |
| Daily | 5.00% | 5.13% | $10,512.67 | $16,486.65 |
The take from the table is counterintuitive. The compounding-frequency line is real but small. The interest-rate line is enormous. A 5.10% APY account compounded monthly beats a 5.00% APY account compounded daily, every single time. Pick the rate first, the schedule second.
The same logic applies in reverse to anyone reading marketing copy. A bank that advertises a generous "compounded daily" line on a low headline rate is doing the same trick as a coffee shop that brags about its bean origin while charging $7. The substance lives in the rate. Compounding is the marketing.
APY vs APR Across Savings Products and Loans
APR is the cousin who lives on the borrowing side of the family. Same surname, different job. APY tells a saver what they earn. APR tells a borrower what a loan really costs once the fees are baked in.
APR (Annual Percentage Rate) lives under the Truth in Lending Act, codified as Regulation Z. It applies to loans, credit cards, mortgages, the works. The formula varies a bit by product, but the canonical simple version reads:
APR = ((interest + fees) / principal / days) × 365
So: APR rolls fees into the rate. APY rolls compounding into the rate. At the same nominal headline number, the saver makes a little more than the rate suggests, and the borrower pays a little more than the rate suggests. Two examples to anchor the contrast:
- A savings product at 5.00% nominal pays the saver about 5.13% APY.
- A $300,000 mortgage at 6.50% with $6,000 in fees costs the borrower about 6.72% APR.
Then there is the liquidity layer that headline APY ignores entirely. A money market account, a savings account, and a CD can all advertise identical APY numbers and still behave nothing alike. Lock $10,000 into a 12-month CD at 4.10% APY and the rate is fixed, but try to pull the cash early and the bank claws back interest as a penalty. Park the same $10,000 in an HYSA at 4.10% APY and you can move it any day, but next month's rate could be 3.50% if the Fed cuts again. Reading only the APY and ignoring the surrounding terms is the exact error the disclosure rules were written to head off.
Current 2026 US Savings Account Rates and CDs
As of May 2026, the gap between the average U.S. savings account and the best high-yield options has rarely been larger.
| Product | National average APY | Top APY available | Source |
|---|---|---|---|
| Standard savings account | 0.38% | up to 4.21% | FDIC, Bankrate, May 2026 |
| Money market account | 0.43% to 0.57% | up to 4.00% | FDIC, NerdWallet, May 2026 |
| 3-month CD | 1.25% | up to 4.50% | Motley Fool, FDIC, April 2026 |
| 6-month CD | 1.44% | up to 4.85% | Motley Fool, Bankrate, April 2026 |
| 12-month CD | 1.93% | up to 4.10% | NerdWallet, April 2026 |
The roughly tenfold gap between national average and top APYs is mostly a story about overhead. Online-only banks and credit unions pay more because they do not carry branch real estate. Promotional offers can push above 5.00%, but those tend to be limited-time tiers tied to balance minimums or new-money requirements.
For a saver with $25,000 sitting in a traditional savings account at 0.38%, the choice to earn interest at a top HYSA paying 4.21% would change annual interest from $95 to $1,053. The difference is the work nobody is doing for them. APY exists to make that comparison legible in thirty seconds. Over half of U.S. consumers still leave the money where it sits.
What the Federal Reserve Does to Your APY
Savings APYs are not random. They track the federal funds rate, the rate U.S. banks charge each other on overnight reserves, which the Federal Open Market Committee sets eight times a year.
Through 2024 and most of 2025 that rate held at 4.25%-4.50%. Then the FOMC cut three times in the back half of 2025: September first, then October, then December. Target range now sits at 3.50%-3.75%, and the committee has held it there through April 2026. The December 2025 dot plot signalled only one more cut in 2026 and one more in 2027. Whether either lands depends on inflation prints and the jobs data, but the broad path the Fed has telegraphed is "slow".
The downstream effect on bank accounts is immediate. Remember those HYSA leaderboards from late 2024 with 5.00%-5.50% APY headlines? Gone. By May 2026 the same products advertise 4.00%-4.21%. CDs follow the same curve on a slight lag. So what does that mean in practice? Locking a 12-month CD at 4.10% APY now looks defensible if you expect HYSAs to drift lower over the year. On the borrowing side it cuts the other way. Variable-rate APRs on home equity lines have eased a touch, but a typical 30-year fixed mortgage still prints around 6.5%.
DeFi APY: Aave, Compound, Lido, and Beyond
Crypto and DeFi platforms quote yields in the same APY vocabulary, and the formula behaves the same way, but the products underneath are very different from a U.S. deposit account. None of them is FDIC-insured. Smart contract risk, peg risk, and protocol governance risk all sit on top of the yield.
A snapshot of headline 2026 DeFi APYs across the most-watched products:
| Product | Type | APY (early 2026) | Source |
|---|---|---|---|
| Aave V3 USDC supply (Ethereum) | Stablecoin lending | ~3.70% spot | DeFiLlama |
| Sky Savings Rate (sUSDS) | Stablecoin savings | ~4.5% to 7.0% | Sky / Dune |
| Ethena sUSDe | Stablecoin yield | ~3.6% to 4.8% | DeFiLlama, Stablecoin Insider |
| Lido stETH | ETH liquid staking | ~2.6% to 3.2% | StakingRewards |
| Ethereum native staking | Validator rewards | ~2.8% to 3.3% | beaconcha.in |
| Solana staking | Validator rewards | ~5.9% | StakingRewards |
| Cosmos ATOM staking | Validator rewards (nominal) | 15-19% | StakingRewards |
The Cosmos number is the easiest example of an APY that needs reading carefully. The 15%-19% nominal yield comes partly from inflation: the network mints new ATOM to pay validators. Real yield, after accounting for token-supply dilution at roughly 10%-14% inflation, lands closer to 2%-8%. That is a structural difference from a U.S. savings account, where inflation does not appear inside the APY at all.
Stablecoin yields have compressed even further. In late 2024, Ethena's sUSDe was paying 10%-15% APY on the back of high perpetual funding rates. By early 2026, those same yields had fallen below 5%. Aave's USDC supply yield, often used as the DeFi benchmark for "safe" stablecoin lending, sits in the same band as a top U.S. HYSA. The "DeFi pays more than your bank" thesis held up well in 2024 and is much less so today.

When DeFi APY Becomes a Trap: The Anchor Lesson
The most-cited cautionary tale in the entire APY literature is Anchor Protocol, the savings product on the Terra blockchain that paid 19.5%-20% APY on terraUSD (UST), the algorithmic stablecoin behind the Terra ecosystem.
Anchor's APY was not earned organically. It came largely out of a yield reserve that the Terra Foundation topped up to keep the headline rate stable. By early 2022, the protocol held roughly $14 billion in deposits, equal to about 75% of UST's circulating supply. That concentration is what eventually broke it.
On May 7, 2022, two large addresses pulled 375 million UST from a Curve liquidity pool. The withdrawal triggered a price wobble, the wobble triggered more withdrawals, and over the next four days roughly $11 billion in UST was pulled out of Anchor. UST's algorithmic peg to the dollar broke. LUNA, the sister token used to absorb peg pressure, hyperinflated and collapsed by 96% to under $0.10. Research published by MIT Sloan's Center for Finance and Innovation, the National Bureau of Economic Research (Liu et al., paper w31160), and Harvard's Corporate Governance Forum estimates that the broader Terra ecosystem lost roughly $50 billion in value across three days.
Anchor was not a fraud in the conventional sense. It was, however, a textbook example of what an unsustainable APY looks like. The yield came from a reserve, not from revenue. When deposit growth slowed, the reserve began to drain. Once depositors realised the math, the run was rational rather than panicked. The same structural pattern shows up in 2025 token-emission farms and pump-and-dump pools. DappRadar's tracking placed total 2025 rug-pull losses in the multi-billion-dollar range, with fewer incidents than 2024 but larger individual hits.
The simple rule that came out of Anchor: if a DeFi APY is materially higher than the rest of the market and the explanation is "subsidised emissions" or "growth incentives", treat it as a marketing rate, not a yield.
How to Choose Between TradFi and DeFi APYs
A reasonable mental framework is to compare on three axes: rate, term, and risk. APY only captures the first axis. The other two often matter more.
For a U.S. saver with an emergency fund or near-term goal, the TradFi side of the comparison is straightforward. A top HYSA paying 4.0%-4.2% APY with FDIC insurance up to $250,000 per depositor per institution remains the cleanest baseline. CDs add 30-50 basis points in exchange for a fixed term. Money market accounts sit in between. Anything advertised at materially above 5.00% in May 2026 should prompt a second look at the small print.
For someone willing to take on smart contract and peg risk, DeFi is no longer the obvious upgrade it looked like in 2024. Aave and Compound USDC supply yields broadly track HYSAs. Sky's sUSDS premium tier offers a 200-300 basis-point pickup but inherits the underlying DAI/USDS protocol risk. Restaking layered yields (ether.fi, Renzo) advertise composite APRs of 10%-15%, but those numbers are the sum of base ETH staking, AVS rewards, points programs, and DeFi farming, each of which carries its own discount factor.
Three filters that tend to keep an investor out of trouble:
- If the headline APY is more than double the closest TradFi equivalent, ask where the yield is coming from. Subsidised emissions, points expectations, and reserve top-ups are not yield.
- If the protocol's TVL doubled in the past month and most deposits are concentrated in a single product, treat that as a stress signal, not a confidence signal.
- For stablecoins, look at the peg history during a previous market stress event. UST passed every nominal test until it did not.
The FINRA Foundation's 2024 National Financial Capability Study, surveying more than 25,500 U.S. adults, found that 71% of respondents answered a basic compound-interest question incorrectly. That is the audience APY disclosure rules were written for. The audience that DeFi marketing copy is written for is different, but the math is the same. The rate matters. The term matters more than the rate often suggests. The risk matters most of all.


