TVL in DeFi: Total Value Locked Guide for Investors
TVL in DeFi is probably the most cited number in the decentralized finance space, and the one retail investors understand least well. It tries to capture the total amount of money flowing through dapps, decentralized lending, and on-chain financial services in one headline figure. On April 17, 2026, Ethereum's TVL stands at $57.23 billion, Solana's at $6.05 billion, and Aave V3 alone holds $26.18 billion across its markets. Those numbers mean something, but what they actually tell you as an investor depends entirely on how you read them. A rising TVL is not automatically bullish. A falling TVL is not automatically bearish. The goal of this guide is to give you the reading skill.
This is a practical guide to using TVL for investing. What it measures, how it is calculated, where it lies, what to pair it with, and the 90-second checklist you should run before depositing a single dollar. Real 2026 numbers throughout. No fluff.
What is TVL in DeFi? Definition and formula
TVL stands for Total Value Locked. It measures the total amount of digital assets, in dollar value, deposited in a decentralized finance protocol at a given moment. It is how the DeFi ecosystem tracks the amount of assets locked across every platform, lending market, and liquidity pool. If you deposit $1,000 of ETH into Aave to earn lending interest, Aave's TVL increases by $1,000. If a thousand users do the same, TVL rises by $1 million. It is inventory of deposits, expressed in US dollars.
The formula is simple. Take every crypto asset held in the protocol's smart contracts, multiply each by its current market price, and sum. That snapshot is TVL at that moment, and it measures the total amount of capital the protocol has attracted across its decentralized financial services.
What TVL measures well: how much capital a DeFi project or set of protocols has attracted right now. It is a rough proxy for capital intermediated outside traditional finance and banking rails, routed through on-chain lending, borrowing, and liquidity pools.
What TVL does not measure: protocol revenue, protocol usage, protocol health, whether that capital is productive, whether it will stay. A protocol with $10 billion in TVL and no transaction fees is a bank that takes deposits and never makes loans. A protocol with $200 million in TVL generating $50 million in annual revenue is arguably healthier. TVL is one input, not a verdict.
How TVL is calculated: the calculation behind it
TVL is calculated by summing the US dollar value of every on-chain asset held in a protocol's smart contract at a point in time. For a lending protocol, that includes supplied collateral plus supplied lending capital (minus borrowed-out capital in some methodologies). For a DEX like Uniswap, it includes both sides of every liquidity pool. For a staking protocol like Lido, it includes all ETH staked through the contract.
The calculation changes with market prices. If Bitcoin drops 20% overnight, every protocol that holds BTC sees its TVL drop 20% on paper, even if not a single user withdrew. That volatility is one reason why TVL figures move every minute.
Aggregators like DefiLlama do real-time on-chain data pulls from blockchain nodes and pricing feeds. When DefiLlama fixed its methodology in 2022 (removing the Saber scheme's inflated TVL on Solana), Solana TVL figures dropped by billions of dollars overnight without any user movement. The number had not actually changed. The way we measured it had.
Current TVL in DeFi 2026: chain breakdown
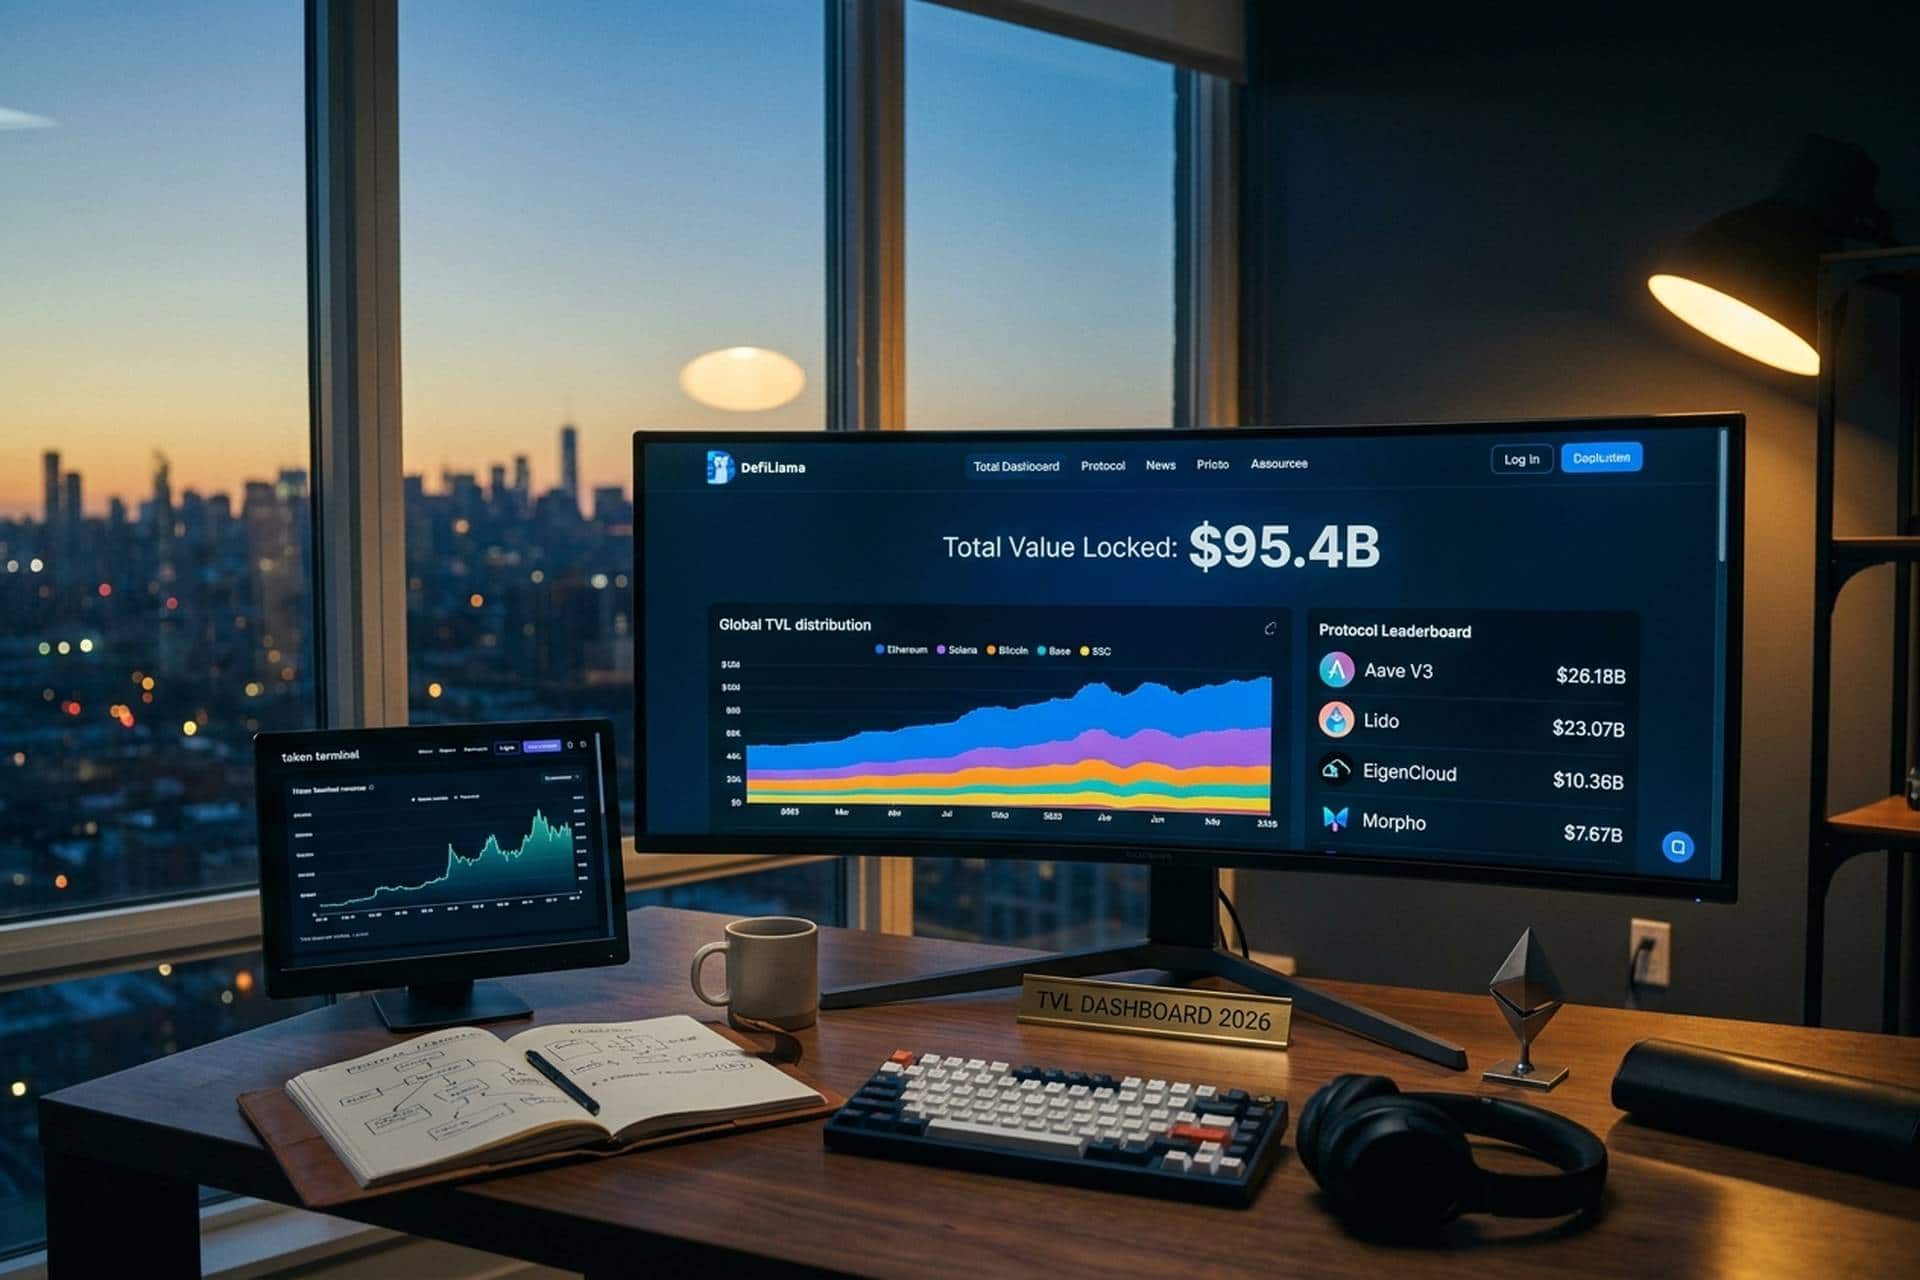
As of April 17, 2026, DefiLlama tracks total DeFi TVL in the $95-140 billion range depending on whether you include liquid staking tokens (LSTs), restaking, and Bitcoin DeFi. Here is the chain-level snapshot, pulled directly from DefiLlama's API.
| Chain | TVL (April 17, 2026) | Share |
|---|---|---|
| Ethereum | $57.23B | ~50% |
| Solana | $6.05B | 5-6% |
| BNB Chain | $5.66B | ~5% |
| Bitcoin DeFi | $5.28B | ~5% |
| Tron | $5.15B | ~5% |
| Base | $4.68B | ~4% |
| Arbitrum | $2.03B | ~2% |
| Hyperliquid L1 | $1.68B | ~1.5% |
Ethereum remains the dominant DeFi chain with roughly half of global TVL. Solana consolidated its second-place position through 2025 but has flattened. Base, Coinbase's L2, climbed into the top 10 by mid-2025. Bitcoin DeFi surged with Babylon Chain, Merlin, and the broader BTC restaking ecosystem.
What these numbers tell you as an investor: where the capital actually sits. Where capital sits is where the fee revenue flows, where the biggest protocols compete, and where the largest attack surface lives. Use this distribution to target your due diligence time.
Top DeFi protocols by TVL right now
The top-of-the-leaderboard picture matters more than the chain-level number for most investors. Here are the top DeFi protocols by TVL on April 17, 2026.
| Protocol | TVL | Category |
|---|---|---|
| Aave V3 | $26.18B | Lending |
| Lido | $23.07B | Liquid staking |
| EigenCloud | $10.36B | Restaking |
| Morpho | $7.67B | Lending (modular) |
| Sky Lending (MakerDAO rebrand) | $6.08B | CDP/lending |
| Ethena USDe | $5.83B | Synthetic stable |
| ether.fi | $5.66B | Liquid restaking |
Aave has been the #1 lending protocol for more than three years, through bear and bull markets. Lido has been the largest single DeFi protocol by TVL for most of 2024 and 2025, driven by ETH staking. EigenCloud (rebranded from EigenLayer) captures restaking flows but depends heavily on native ETH versus LST deposits, which creates measurement nuances we'll come back to.
For a first-time DeFi investor, the top 10 TVL protocols are the default blue-chip set. They are not guaranteed safe (no protocol is), but they have the most audits, the deepest liquidity, and the longest uninterrupted operating track records.
Historical TVL: from $38B to $178B and back
A brief history helps put today's TVL figures in context.
- November 2021 peak: roughly $178-180 billion. The absolute all-time high, during DeFi Summer's spillover and the 2021 bull market.
- August 2023 bottom: approximately $38 billion. The post-FTX, post-Terra low point. About 79% off the 2021 peak.
- December 2024: $130 billion, driven by ETH price recovery plus the restaking boom and stablecoin growth.
- 2025 cycle: bounced between $123 billion trough and a new cycle peak around $178 billion.
- April 17, 2026: $95-140 billion, depending on methodology.
The shape of the TVL curve is mostly correlated with ETH and BTC price action, not with independent DeFi adoption. When ETH drops 50%, TVL denominated in USD drops nearly as much, because most TVL is ETH or ETH-pegged. When crypto prices recover, TVL recovers too. This is why a savvy investor reads TVL changes alongside price movements rather than as a standalone signal.
Why TVL matters for cryptocurrency investors
TVL matters for cryptocurrency investors for three practical reasons.
First, it tells you where the liquidity sits. If you want to earn yield on USDC or lend stablecoins, you want to know which lending protocols have the deepest pools, because depth determines stability of rates and probability of being able to withdraw when you want to. A $5 billion protocol with a $100 million USDC pool is more reliable than a $200 million protocol with a $10 million pool.
Second, it gives you a rough security signal. Protocols with higher TVL tend to attract more audits, more security researchers, and more public scrutiny. They also become bigger targets, which cuts the other way. But over multiple years, a protocol that has held $10 billion in TVL through multiple cycles without being exploited has a better track record than one that just crossed $100 million last month.
Third, it enables comparative analysis across the DeFi space. You cannot compare a lending protocol to a DEX based on fees alone; the fee structures differ. You can compare them by TVL, which normalizes for scale, then look at ratios like fees-per-TVL or revenue-per-TVL to understand capital efficiency.
MC/TVL ratio: reading valuation like an investor
The single most useful derived metric from TVL for investors is the market cap to TVL ratio (MC/TVL). It compares a protocol's token valuation with the capital it has attracted.
Rough interpretation, based on observed patterns over multiple cycles:
- MC/TVL below 0.5: Often signals the token is undervalued relative to protocol adoption. Lido has consistently traded near 0.03-0.05, meaning its token market cap is a small fraction of the capital in its smart contracts.
- MC/TVL between 0.5 and 1: Typical for mature DeFi protocols. Aave has traded around 0.08-0.15 for much of 2024-2026, suggesting solid fundamentals.
- MC/TVL above 1: The token market cap exceeds the capital the protocol holds. Uniswap has often sat above 1.0, reflecting premium market pricing despite not capturing all of the value it generates in fees. This can signal either strong forward expectations or overvaluation.
Use MC/TVL as a starting screen, not a verdict. Protocols with different business models generate different levels of fee revenue per dollar of TVL, so a lending protocol at MC/TVL 0.1 is not directly comparable with a derivatives protocol at 0.5. Use it to narrow the watchlist, then dig into revenue and growth before committing capital.
Liquid staking, EigenLayer, and TVL double-counting
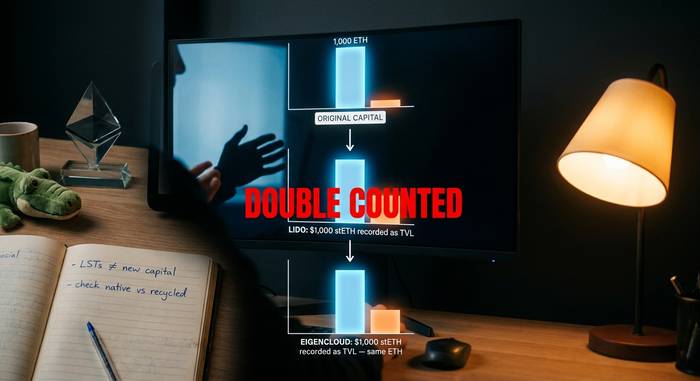
One of the trickier wrinkles in 2026 TVL data is restaking and liquid staking token (LST) double-counting. Here is what actually happens.
You stake ETH through Lido. Lido records $X of TVL. You receive stETH (a liquid staking token) in return. Now you deposit that stETH into EigenCloud for restaking rewards. EigenCloud records $X of TVL too. The same underlying ETH is counted once on Lido and once on EigenCloud. Sum the two naively and you overstate the capital in DeFi by the same amount.
DefiLlama attempts to deduplicate, and their public breakdown shows that roughly 16% of EigenCloud's TVL is restaked LSTs (double-counted in the naive sum) while the remaining 84% is "new" capital (native ETH or non-LST assets). For other restaking and LRT protocols (ether.fi, Renzo, Swell), the ratios differ. For a real picture of capital in DeFi, subtract the LST double-counting.
Why this matters for investors: if you read "EigenLayer hit $28.6B TVL at peak" in a tweet, remember that a sizeable fraction of that was recycled capital, not fresh deposits. Your investment thesis should account for which protocols are getting truly new inflows versus which are just capturing already-productive capital.
How to use DefiLlama and other TVL trackers
DefiLlama is the default free tracker for DeFi TVL. For most investors, its web interface plus its public API covers 90% of what you need.
Essential DefiLlama views:
- Global dashboard: total DeFi TVL, chain share breakdown, historical chart.
- Chain view: TVL by protocol within each chain, stablecoin breakdown, bridge activity.
- Protocol view: individual protocol TVL history, revenue, fees, token price, MC/TVL.
- Stablecoins dashboard: USDT, USDC, DAI, USDe, plus circulation by chain.
- Yield dashboard: live APY on all major lending pools and vaults.
Complementary tools:
- Token Terminal for protocol revenue and fee data.
- Dune Analytics for custom on-chain queries and dashboards.
- Nansen for wallet-level flows (premium).
- Artemis for chain activity metrics beyond TVL.
- DeBank for wallet portfolio tracking across protocols.
A standard workflow: screen on DefiLlama, confirm revenue and growth on Token Terminal, verify wallet concentration on Etherscan or Nansen. Do not trust a single data source. Aggregators occasionally disagree, and methodology differences matter more than you'd expect.
Red flags: inflated TVL and mercenary liquidity
TVL can be inflated. Smart investors know the specific ways it happens.
Mercenary liquidity is the most common. A new protocol offers outsized token incentives to attract deposits. TVL surges. Then the incentives run out, depositors pull their funds in days, and TVL collapses. The Berachain Boyco vault post-launch is a 2025 example: billions in pre-launch TVL evaporated once the bonus emission schedule ended. If a protocol's TVL spikes right before a token launch and there's a clear unlock date, assume the TVL is temporary unless proven otherwise.
Ghost TVL is another. Wrapped assets (wBTC, wETH) can be counted on both their origin chain and the wrapper protocol. Some aggregators double-count; others do not. Always check which view you are looking at.
TVL rug-adjacent events are rarer but real. HyperVault's September 2025 rug pulled $3.6 million out within hours. ZeroLend collapsed 98% in February 2026 after a depegging cascade. In 2025, DefiLlama counted roughly $6 billion in total rug-related TVL losses across the broader ecosystem. A protocol with rising TVL and anonymous operators is a specific category of risk.
What to check before trusting any TVL figure:
- Is it supported by real usage (lending activity, swap volume, fee generation)?
- Are the top depositors diversified, or is 60% in one wallet?
- Does the protocol have a public team with named accountability?
- Has TVL held steady through one full bear cycle (typically 12-18 months)?
- Is the protocol offering unsustainable incentive APYs above 20%+?
If the answers skew toward "no", the TVL number is unreliable as a health signal.
TVL vs revenue: real yield and capital efficiency
A pattern that has matured across 2024-2026 is the shift toward capital efficiency over raw TVL. Fintech Weekly estimated that between 83-95% of deposited liquidity across major protocols is effectively dormant, meaning it is not generating fees or productive use. More than $12 billion of DeFi TVL sits in that dormant band. Raw TVL tells you capital is there; it does not tell you capital is working.
Real yield protocols separate themselves by revenue per unit of TVL. Hyperliquid processed $492 billion in Q1 2026 perp volume and generated roughly $844 million in 2025 protocol revenue, despite sitting with a much smaller TVL than Aave. dYdX and GMX sit below 3% revenue-to-TVL efficiency. Aerodrome on Base has emerged as one of the higher-efficiency DEXes.
For investors, the practical move is to layer a revenue filter over any TVL-based screening. Check protocol fees and revenue on Token Terminal. Look for consistent growth over 6-12 months rather than spiky weeks. Favor protocols where revenue is growing faster than TVL; that means the capital is becoming more productive, not less.
A high TVL with flat or declining revenue is a yellow flag. It usually means either mercenary liquidity is aging out, or the protocol's market is saturated, or the product is not fitting user demand anymore.
Practical TVL checklist before you deposit funds
A 90-second checklist before you put any money into a DeFi protocol based on its TVL.
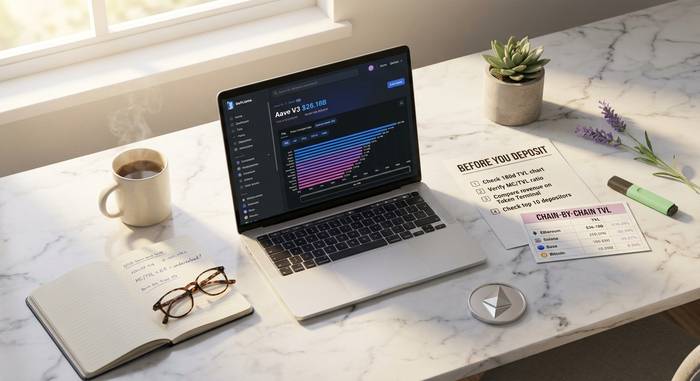
1. Check the current TVL on DefiLlama. Confirm it matches what the protocol claims on its homepage.
2. Pull up the 180-day TVL chart. Is it steady, rising, or had a recent spike?
3. Check MC/TVL ratio. Is the token valuation reasonable relative to capital attracted?
4. Check revenue on Token Terminal. Is the protocol earning, or just sitting on deposits?
5. Check if TVL is supported by LST/LRT reuse. Native capital is stronger than recycled.
6. Look at the top 10 depositor addresses. If one or two wallets dominate, TVL is fragile.
7. Check incentive schedule. Are emissions ending soon? If yes, TVL will likely drop.
8. Verify audit status. Has the protocol been audited by a reputable firm (Trail of Bits, Halborn, CertiK, SlowMist)?
9. Confirm team transparency. Public team? Anonymous? Both exist in good and bad setups.
10. Size your deposit. Even blue-chip protocols have non-zero exploit risk; diversify.
Done. If a protocol passes all ten, you have done more due diligence than 95% of retail DeFi users. If any three fail, look harder or skip.


