Morning Star Pattern: Bullish Reversal and How to Trade It

Traders treat the morning star pattern as one of the chart's most trustworthy "the bottom is in" signals. On stock charts, the data mostly backs that reputation. On crypto, it is shakier than most guides admit. Both of those things are true at once, and holding them together is the whole point of using the pattern well instead of blindly.
This guide covers what the morning star is, the three candles that build it, how to actually trade it with sane entries and stops, how reliable it is once you look at real numbers, and the question almost no one answers honestly: does it work in crypto?
What Is the Morning Star Pattern?
The morning star candlestick pattern is a bullish reversal signal that shows up at the bottom of a downtrend. It is a three-candle picture of a mood swing on the chart: a market running out of sellers and slowly handing control to buyers.
The name does the explaining. A morning star is the last light before dawn, and the pattern is meant to mark the end of a dark stretch of selling. It comes straight out of Japanese candlestick analysis, the same tradition that gives us the doji and the hammer, and it remains one of the first chart patterns most traders learn in technical analysis.
What it claims to tell you is simple: the downtrend is probably exhausted, and a move higher may be starting. Whether you believe that claim is exactly what the rest of this guide is about.
You will find the morning star quoted across every market that uses candlesticks, from stocks and forex to commodities and crypto, and it sits near the top of most traders' lists of reversal signals. Part of that popularity is real performance, which we will get to, and part is simply that it is easy to spot. A clean morning star at the bottom of a long slide is one of the few shapes on a candlestick chart that even a beginner can pick out at a glance, which is both its strength and, as we will see, a trap.
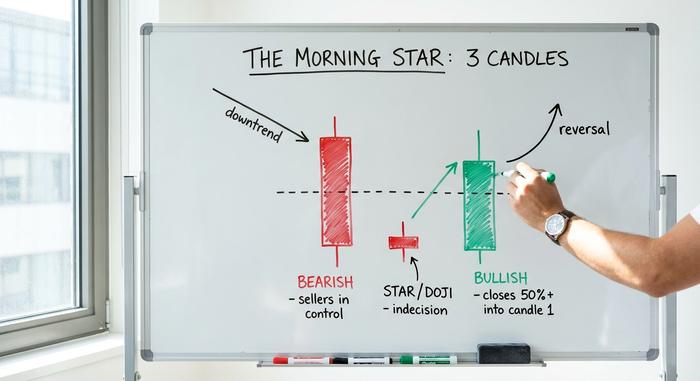
The Three Candles That Form a Morning Star
A morning star lives or dies on its third candle. The first two only set the stage.
The first candle
The first candle is long and bearish, a solid red body that fits right into the existing downtrend. Sellers are still firmly in charge, and nothing here looks like a turn yet. If anything, it confirms the gloom.
The second candle
The second candle is the star itself: a small body that gaps lower, often a doji, where open and close finish almost level. Its color barely matters; what matters is that the body is small. This is market indecision made visible. The sellers pushed price down again, but they could not hold it, and buyers started pushing back. Neither side won the session. That stalemate is the hinge the whole pattern swings on, and it is why a tiny, balanced second candle makes for a more convincing morning star than a fat one.
The third candle
The third candle is long and bullish, and it must close at least halfway up the first candle's body. That 50% close is the canonical rule, set out by Steve Nison in his foundational work on Japanese candlesticks and echoed by later researchers. It is the buyers' answer to the sellers' opening statement. The deeper the third candle eats into the first, the more convincing the reversal; a third candle that closes right back at the top of the first is about as strong a signal as the pattern offers. If the third candle is weak or barely green, you do not really have a morning star, you have wishful thinking.
The Market Psychology Behind the Reversal
Strip away the jargon and every candlestick pattern is a story about crowd emotion. The morning star tells one of the cleanest.
On day one, sellers dominate and the trend looks safe. On day two, the decline stalls; the small star says the selling pressure is drying up, and neither bulls nor bears can take the session. On day three, buyers stop hesitating and step in with force. In three sessions you watch sentiment travel from confidence to doubt to a change of heart. That emotional arc, not the geometry, is what gives the pattern its reputation as a trend reversal signal.
It also explains why context decides everything. The same three candles after a long, painful sell-off near a known support level mean far more than the same shape in the middle of choppy, directionless trading. In the first case, the crowd is genuinely exhausted and primed to flip. In the second, the "reversal" is just noise wearing a costume. Read the price action and location before you read the candles.
How to Trade the Morning Star Pattern
The pattern's real gift is that it hands you clean, mechanical levels. The discipline is waiting for them to confirm instead of jumping the gun.
Entry and confirmation
The standard entry is after the third candle closes above the midpoint of the first. More cautious traders wait for price to break the high of the third candle before committing. Either way, do not trade the star on its own. Look for above-average volume on that third candle, and the relative strength index (RSI) lifting up out of oversold territory below 30. Confirmation from a second tool turns a guess into a setup.
Stop-loss and targets
The stop almost places itself: just below the low of the pattern, which is usually the second candle. If price falls back there, the reversal has failed and you want out cheaply. For targets, a 1:2 risk-reward ratio is a sensible default, but the next clear resistance level or a Fibonacci extension often makes a better exit. Decide both before you enter.
Timeframes
Timeframe matters more than beginners expect. The morning star candlestick is far more reliable on daily and weekly charts, where each candle reflects real conviction. Drop down to a 5- or 15-minute chart and the same shape appears constantly and means almost nothing, drowned in noise. If you only take one rule from this section, take that one.
A worked example
Numbers make it concrete. Say a stock slides for two weeks and prints a long red candle from $52 down to $48. The next day it gaps to $47 and closes at $47.20, a tiny doji-like star. On day three it rallies and closes at $50.50, more than halfway back up the first candle. That is a textbook morning star. A trader might enter near $50.50, place a stop just under the star's low around $46.80, and target the prior resistance near $55. The risk is about $3.70 and the reward about $4.50, a clean setup before you even add volume or RSI as confirmation. Real charts are rarely this tidy, but the logic is always the same.
How Reliable Is the Morning Star? The Data
Most articles assert the pattern is "reliable" and move on. Here is what the numbers actually say, because the gap between reputation and evidence is wide.
The most-cited source is Thomas Bulkowski, who tested candlestick patterns across roughly 5 million candle lines. He puts the morning star's reversal rate at 78%, ranked 6th out of 103 candlestick types for reversals and 12th of 103 for overall performance. That is genuinely strong, and it is why the pattern earns its reputation among stock traders.
| Morning star reliability | Figure |
|---|---|
| Reversal success rate | 78% |
| Reversal rank | 6th of 103 patterns |
| Overall performance rank | 12th of 103 |
| Morning doji star reversal rate | 76% |
| Test dataset | ~5 million candle lines |
Academic work is more cautious but not dismissive. A 1998 study by Caginalp and Laurent found three-candle reversal patterns statistically significant on S&P 500 stocks, some 36 standard deviations away from random chance, though the actual edge was a modest gain over a two-day hold. Treat the headline numbers carefully, though. Some sources quote win rates closer to 60%, and reliability rises sharply when the pattern forms near yearly lows with tall, decisive candles. The pattern is good, not magic.
Two practical caveats sit behind those percentages. First, the morning star is not common; on any single instrument you might wait weeks or months for a clean one on the daily chart, so it rewards patience and rarely hands you a setup every week. Second, every reliability figure assumes you traded the pattern with confirmation and a stop, not on sight. Strip those away and the real-world win rate drops toward a coin flip, which is roughly what undisciplined traders experience and then blame on the pattern.
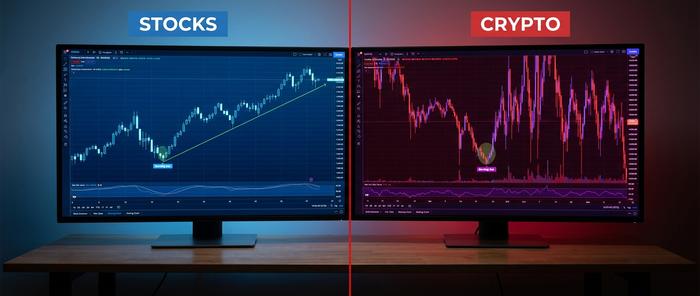
Does the Morning Star Work in Crypto?
This is where honesty matters, because the stock-chart evidence does not automatically carry over to Bitcoin.
The most direct test is discouraging. A 2021 IEEE study checked 68 candlestick patterns across the top 23 cryptocurrencies and found none of them worked reliably; most performed no better than a coin flip. There are good structural reasons. Crypto trades 24 hours a day, seven days a week, so the price gaps between candles that the classic morning star assumes barely exist. Add violent volatility and thinner order books, and false stars multiply.
That said, the chart still throws up textbook examples. Bitcoin bottomed near $15,500 during the FTX collapse in late 2022 and recovered to roughly $23,000 by mid-January 2023, a reversal that looked every bit like a morning star on the higher timeframes. One clean chart is a story, not proof, and for every example like that there are dozens of failed stars nobody screenshots.
My take is simple: in crypto, never trade the morning star alone. The 24/7 market means the dramatic overnight gaps that sharpen the pattern on stocks simply do not form, so what you often get is three candles that resemble a morning star without the underlying gap dynamics that made it meaningful. Use it only as a tiebreaker alongside a real support level, a higher timeframe, and a second indicator, and size the position knowing the edge is thinner here than the trading courses promise. Here, treat the morning star as a hint that still has to prove itself.
Morning Star vs Evening Star Pattern
Learn the morning star and you get its mirror image for free. Together, the morning star and evening star are the two best-known star patterns in candlestick analysis. The evening star is the bearish twin: the same three-candle logic, flipped upside down, marking the top of an uptrend instead of the bottom of a downtrend.
| Feature | Morning star | Evening star |
|---|---|---|
| Appears after | A downtrend | An uptrend |
| Signal | Bullish reversal | Bearish reversal |
| First candle | Long bearish | Long bullish |
| Third candle | Long bullish | Long bearish |
| What you do | Look to buy | Look to sell |
If a small star sits at the peak of a rally and a long red candle follows, you are likely looking at an evening star warning the uptrend is tired. Same psychology, opposite direction — exhaustion of buyers instead of sellers. Knowing both keeps you honest: the same trader who buys a morning star at support should respect an evening star at resistance, rather than only seeing the patterns that fit the trade they already want. The market does not care which direction you are hoping for.
Using the Morning Star Pattern Wisely
The morning star is a useful clue, not a crystal ball. On stock and forex charts it has a real, measurable edge, especially on daily timeframes and near support. In crypto, the evidence is thin enough that you should lean on it the least and confirm it the most. Folded into broader trading strategies rather than used as a lone trigger, it pulls its weight.
Used properly — with volume, an indicator, a clear stop, and the right timeframe — the morning star pattern is a sharp tool for spotting reversals. Used as a standalone buy signal, it is a fast way to lose money. So before you act on the next one you spot, ask the honest question: what else on this chart agrees?


