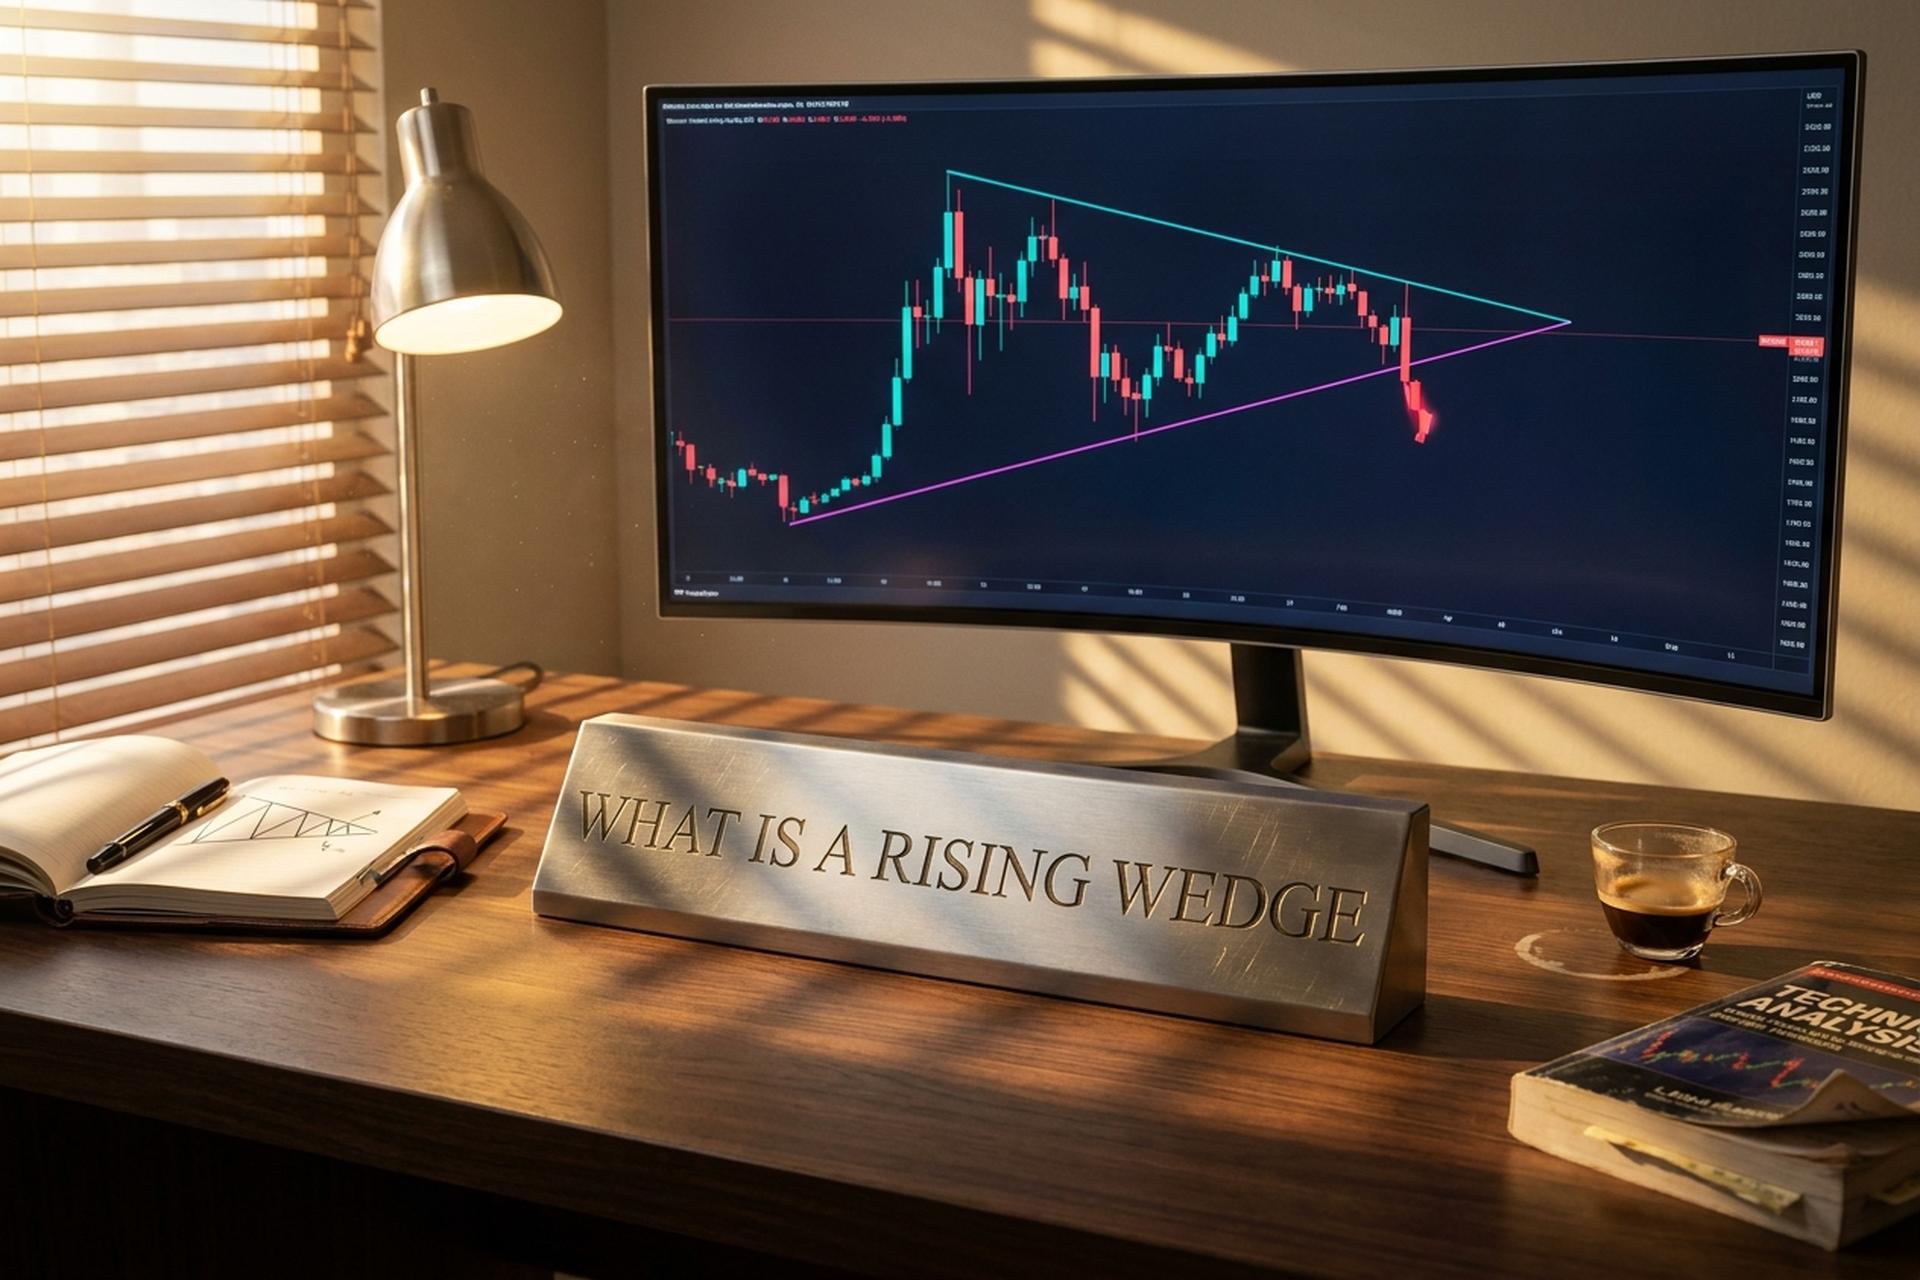
What Is a Rising Wedge Pattern? Reversal Trading Guide
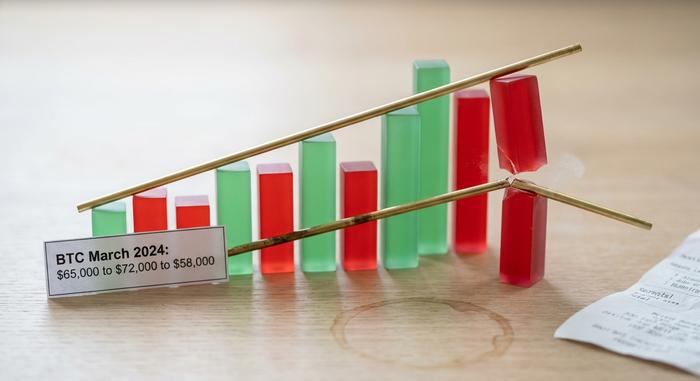
March 2024. Bitcoin tore from $60,000 to over $70,000 in less than two weeks. Looked unstoppable. Then Josh Olszewicz, a crypto analyst, flagged the shape BTC had drawn on the way up: a rising wedge. Two upward-sloping lines squeezing into each other, like a spring losing its tension. Weeks later, BTC was sliding back toward $56,000.
The rising wedge is a sneaky one. Price keeps printing higher highs and higher lows, which screams bullish, yet the pattern itself is a quiet warning. Buyers are running out of steam. Each new peak is reached on weaker conviction than the last. Eventually the floor goes.
This guide breaks the rising wedge down from a crypto trader's seat. We cover what it looks like on a BTC or ETH chart, how it forms, why it usually breaks down, what the actual stats say (spoiler: not what most blogs claim), and how to trade it without walking into a bull trap.
Rising Wedge Pattern: What It Is and Why It Matters
A rising wedge is a chart pattern formed by two upward-sloping trendlines that converge as price moves higher. The lower line, drawn through the swing lows, rises faster than the upper line drawn through the swing highs. The result is a narrowing channel that looks like a wedge tilted upward to the right.
That converging shape is the entire signal. It tells you that bulls are still pushing price up, but each new push is shorter than the one before. Higher highs are getting harder to reach. The bears are creeping closer to the bid. When the two trendlines almost touch, something has to give. In nine cases out of ten, that something is a breakdown below the lower trendline.
Rising wedges show up across every market and timeframe, but they are especially common in crypto. The 24/7 nature of Bitcoin and Ethereum, combined with rapid sentiment swings, means a wedge that takes weeks to form on a stock chart can compress into a few days on a 4-hour BTCUSDT chart. Spotting one early is one of the most useful tools in a crypto trader's playbook.
How a Rising Wedge Forms on a Crypto Chart Pattern
Three things build a rising wedge. First, an existing trend (almost always an uptrend) that gives the pattern direction. Second, at least two swing highs you can connect with a straight line. Third, at least two swing lows joined by a steeper straight line. When both lines tilt up and the lower line is steeper than the upper, the support and resistance trendlines converge. That is your wedge.
Watching price action inside the wedge feels like watching an engine sputter. Each push up reaches a new peak, but the gap between consecutive peaks gets smaller. Each pullback bottoms a little higher, but the gap between lows shrinks faster. Candle bodies get tiny. Wicks stretch out as buyers and sellers slug it out in a tightening range.
Volume tells you the same story from another angle. In a healthy uptrend, volume rises with price. Inside a rising wedge? Volume usually fades as the wedge tightens. Bulkowski clocked this declining-volume signature in 79% of rising wedges across his 1,400-trade sample. Fewer hands. Smaller pushes. Weaker conviction. By the time the wedge nears its apex, the chart looks brittle. Then a candle closes hard below the lower trendline, almost always on a fat burst of selling volume, and the pattern is triggered.
Is a Rising Wedge Bullish or Bearish? The Real Answer
Bearish-biased? Yes. Always bearish? No. The statistics tell a more nuanced story than most crypto blogs admit. Thomas Bulkowski's encyclopedia of chart patterns analyzed more than 1,400 rising wedges. His findings: the pattern breaks downward roughly 60% of the time, with the remaining 40% breaking up. Average decline after a downward break? Only about 9% from the breakout point. And 51% of downward breakouts fail to reach a meaningful target. Bulkowski actually ranks the rising wedge near the bottom of his list of profitable patterns. That is the hard data. The "81% success rate" you see quoted everywhere is a different stat about upward continuation in bull markets, and it gets repeated wrong all the time.
So yes, the bearish bias is real. It is also a probability, not a verdict. Roughly 4 in 10 rising wedges break upward, sometimes with a sharp short-squeeze that hurts anyone who shorted on the pattern alone. Treat the wedge as one input among several, not the answer to the question.
Crypto adds another wrinkle. Bitcoin volatility means false breakouts happen more often than on equities. Weekend liquidity is thin. Kaiko data shows weekend price swings run 2 to 3 times weekday norms. So wait for a confirmed close below the lower trendline on a higher timeframe, ideally with a volume spike, before you trust the pattern as triggered.
Rising Wedge as a Reversal Pattern in Uptrends
When a rising wedge prints after a long uptrend, you are looking at a textbook reversal setup. The market has been climbing for weeks. Maybe months. Late buyers are chasing. Sentiment is euphoric. Then the wedge takes shape. Higher highs cluster closer together. Price coils. By the time the breakdown hits, the late longs are stuck. Stops cascade. The trend snaps the other way, sometimes violently.
That is exactly the script Bitcoin followed in March 2024. BTC drew a clean rising wedge from roughly $60,000 to a peak above $73,000. The 10-day rate of change diverged from price as the wedge tightened, a classic warning that momentum was peeling away from the candles. When BTC closed below the wedge support, a 20% pullback followed. Price hit the $57,000 zone inside a few weeks.
Altcoins do the same thing on bigger amplitudes. After Solana ran from $20 to over $250 in late 2023 and early 2024, the parabolic top printed a tightening rising wedge on the daily. The breakdown wiped out roughly half the rally in two months. Reversal wedges at the top of strong trends are some of the highest-probability setups in TA, precisely because the wedge whispers exhaustion at the exact moment the crowd is loudest.
Rising Wedge as a Continuation Pattern in Downtrends
Rising wedges also show up mid-downtrend, where they work as continuation patterns. Price has been bleeding. It bounces off a key support. The bounce takes the shape of a rising wedge with higher highs and higher lows, and the chart momentarily looks like the bottom is in. It is not. Inside the wedge, momentum is still draining. When price finally cracks below the lower trendline, the downtrend resumes. Often with extra conviction.
These continuation wedges are especially brutal in crypto bear markets. Retail piles into the relief rally, sure the worst is over. The wedge forms inside that rally. Breakdown comes. Long liquidations cascade. The move down accelerates. The 2022 bear market was full of these things, punishing bottom-callers in BTC, ETH, and pretty much every altcoin you can name.
How do you tell a reversal wedge from a continuation wedge? Context. If the wedge sits at a fresh all-time high after a long bull run, you are looking at a probable reversal. If the wedge sits inside an established downtrend, between two lower swing highs on the higher timeframe, you are probably looking at a continuation. Same geometry. Two completely different stories. The story is decided by what came before.
Trading the Rising Wedge With Volume and MACD
Pattern recognition alone is not a trading edge. The wedge gets you 80% of the way there, but the real edge comes from layering technical indicators on top of the chart and filtering out false breakouts using volume and momentum tools. The wedge represents a phase of consolidation that has reached its breaking point; what you need is confirmation of which way the dam will give.
Volume is the first filter. A textbook rising wedge has declining volume during formation and a sharp expansion of volume on the breakdown candle. If price breaks below the lower trendline on thin volume, the breakout has roughly a 50/50 chance of failing. Wait for the volume confirmation. In crypto, this means cross-checking spot and futures volume on a major venue and ignoring weekend dust.
The second filter is bearish divergence on a momentum indicator. The MACD is the workhorse. As the wedge forms, price prints higher highs but the MACD prints lower highs, a classic bearish divergence. Combine that with similar divergences on the RSI or the rate of change, and the pattern's probability of resolving lower goes up materially.
A third confirmation worth adding for crypto specifically: the position of the broader market. A rising wedge on a single altcoin, with no equivalent weakness on BTC, often resolves with a fakeout. A rising wedge on BTC itself, alongside macro risk-off conditions, has a much higher hit rate. Always read the wedge in the context of where the dominant asset is in its own cycle.
Some traders also overlay a Bollinger Band squeeze. As the wedge tightens, the bands compress. The eventual breakdown candle usually punctures the lower band with force. It is not a primary signal, but it is a useful tiebreaker when the volume picture is ambiguous.
Price Targets, Stop Loss, and Risk Management
The classical price target for a rising wedge is the height of the pattern at its widest, projected down from the breakdown. Measure the vertical distance between the two trendlines at the start of the wedge. Subtract that from where price closed on the breakdown candle. That number is your measured-move target.
How often does it actually hit? Bulkowski's data says only about 32% on downward breaks. Which is exactly why disciplined traders book partial profits on the way rather than holding for the full target. Around 72% of rising wedges throw price back to retest the broken trendline before continuing lower. That throwback is the highest-probability re-entry zone for anyone who missed the first break.
Stop loss placement is non-negotiable. Two reasonable approaches:
| Approach | Stop Loss Location | Pros | Cons |
|---|---|---|---|
| Tight stop | Just above the most recent lower high inside the wedge | Best risk-to-reward, often 1:5 or better | Higher chance of being wicked out on noise |
| Wide stop | Above the wedge apex or recent swing high | More room, fewer false stops | Worse R:R, often 1:2 or 1:3 |
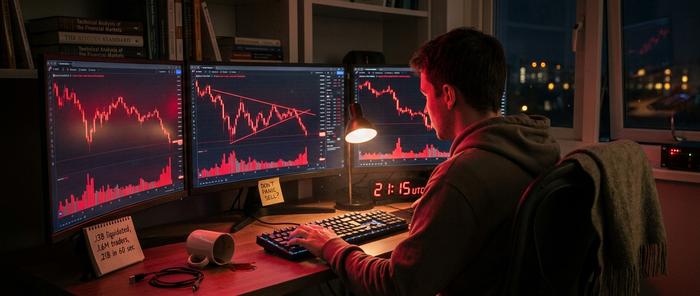
In crypto, wider beats tighter most days. Bitcoin can wick 3 to 5% in minutes during a low-liquidity Asian session. A stop placed too close to the breakdown candle gets flushed before the real move plays out. Take the October 10-11, 2025 cascade. $19.13 billion liquidated across 1.6 million traders. $3.21 billion vanished in a single 60-second window at 21:15 UTC. A wedge breakdown on a weekend with that kind of margin debt stacked underneath can blow through any tight stop in seconds. Aim for at least 1:2 risk-to-reward. Use 1:3 as your healthy benchmark.
Quick note on position sizing. Even great patterns lose. Roughly 4 in 10 rising wedges break the wrong way, and many "right" breaks still fail to extend. So risk no more than 1 to 2% of your account on a single wedge trade. Two or three losing wedges in a row happens more often than you would think. Disciplined sizing keeps you in the game when it does.
Strategies for Trading Rising Wedges in Crypto
Traders use the rising wedge in three main ways, and each comes with its own playbook.
The first is the breakdown short. Wait for a daily or 4-hour close below the lower trendline on rising volume. Enter short on the close. Stop above the most recent swing high inside the wedge. First target at the measured-move projection. Trail the rest of the position with a moving stop. This is the cleanest setup and the one most suited to swing traders who can wait days or weeks for the move to mature.
The second is the throwback short. Skip the breakdown candle. Wait for price to retest the broken trendline from below, often within one to three sessions of the initial break. Enter short on the rejection. Stop above the broken trendline plus a small buffer. Same target as the breakdown short. The advantage is a tighter stop and a better R:R. The disadvantage is that you sometimes miss the trade entirely if the throwback never materializes.
The third is the contrarian fade. About 17% of rising wedges break to the upside. Some traders watch for a strong upward break on heavy volume, accompanied by news or a macro catalyst, and go long with a tight stop below the broken upper trendline. This is a lower-probability setup, but it can be lucrative on the rare occasions it works. Most traders should ignore it until they have logged at least a few hundred wedge trades and built up real instinct for the false-break setup.
In all three cases, define your invalidation level before you enter. If price closes back above the broken trendline on conviction, the trade is wrong, get out, do not average in. The pattern's edge comes from being mechanical, not from hoping.
Rising Wedge vs Falling Wedge: What's the Difference?
The rising wedge has a mirror twin called, predictably, the falling wedge. Both share the same converging-trendline geometry. What changes is direction. The falling wedge slopes down. Its upper line, drawn through the swing highs, falls faster than its lower line drawn through the swing lows. The shape narrows pointing down and to the right.
Flip the slope, flip the bias. A falling wedge is a bullish pattern in roughly 70% of cases. It typically forms during a downtrend or a deep correction within a larger uptrend, and it usually breaks up. Where the rising wedge means exhausted bulls, the falling wedge means exhausted bears. Where the rising wedge sets up a bull trap, the falling wedge sets up a bear trap, a final flush of weak shorts before price reverses higher.
Quick side-by-side:
| Feature | Rising Wedge | Falling Wedge |
|---|---|---|
| Slope of trendlines | Both up | Both down |
| Steeper line | Lower (support) | Upper (resistance) |
| Volume during formation | Declining | Declining |
| Most common breakout | Down (≈81%) | Up (≈70%) |
| Typical context | End of uptrend or relief rally in downtrend | End of downtrend or pullback in uptrend |
| Trader bias | Short on breakdown | Long on breakout |
In crypto, both wedges work on every timeframe from 15 minutes to weekly, but the higher the timeframe, the more reliable the signal. A falling wedge on the daily BTC chart after a deep correction is one of the highest-conviction long setups in technical analysis. A rising wedge on the daily after a parabolic run is its bearish counterpart. Knowing which is which, and reading the trend context correctly, is half the battle.
Bitcoin Rising Wedge Examples From 2022-2025
History gives the pattern its credibility. Three BTC examples from the last few years are worth studying carefully.
Start with the late-2021 top. BTC ran from roughly $30,000 in July 2021 to an all-time high near $69,000 by early November. That final leg drew a textbook rising wedge on the daily, complete with declining volume and a clean MACD bearish divergence. When the wedge cracked in mid-November, BTC fell off a cliff. By November 2022, it was below $16,000. Around 75% off the wedge breakdown. Anyone short the pattern with a conservative stop and a measured target rode a generational move down.
Second example: the 2022 bear-market continuation wedge. Between June and August 2022, after the LUNA collapse, BTC bounced from $17,600 to $25,200. The bounce traced a clean rising wedge on the daily. Wedge broke down late August. BTC slid roughly 40%, hitting $15,500 by November. A continuation wedge in the middle of a confirmed downtrend. The exact thing that traps bottom-callers.
Third: the March 2024 wedge already mentioned in the intro. BTC rallied from $60,000 to a then-all-time-high above $73,000 between late February and mid-March. Olszewicz flagged the wedge in real time on CoinDesk. ROC diverged from price. The wedge broke down in late March, and BTC pulled back 22% to the $57,000 zone in five weeks before the next leg up began. Even raging bull markets respect the geometry.
The pattern kept printing across 2024-2026. In August 2024, Ali Martinez flagged a daily rising wedge on BTC near $57,000 with a target near $51,000, an 11% drop. In April 2025, CoinDesk Research highlighted an XRP rising wedge pointing to $1.60. By March 2026, Ethereum was coiling inside a rising wedge near $1,987 on the daily, and NewsBTC analysts saw $1,500 as the next high-timeframe support, a 25% drop if confirmed. Solana traced its own version after a 150% 2025 rebound, with a breakdown target near $200.
The checklist looked the same in every case. Converging trendlines on the daily. Declining volume during formation. A momentum divergence on MACD or rate of change. A confirmed close below the lower trendline. No fancy tools. Just patience and the discipline to wait for confirmation.


