Dune Analytics: A Beginner’s Guide to On-Chain Crypto Data

A public blockchain hides nothing and reveals nothing, both at once. Every swap, mint, and transfer on Ethereum or Solana is recorded forever, in the open. Try to read it raw, though, and you get hex strings and 42-character addresses by the million. Dune Analytics is the translation layer. It turns that raw activity into dashboards and charts a normal person can read in seconds. Is this airdrop real? How much does this protocol actually earn? Where did that whale just move funds? Those are Dune questions.
This guide covers what Dune Analytics is, how it works under the hood, and how to get a real answer out of it today, even with zero coding experience.
What Is Dune Analytics and Who Built It
Dune is a community-driven crypto data platform, and here is the twist that makes it different. It does not sell you a finished report. It hands everyone the raw on-chain data plus the tools to query it, then lets the community build the dashboards and share them for free. That is why people call it "the GitHub for blockchain data." Most of what you see on Dune was built by other users, and you can copy any of it. Analysts use it. Funds use it. So do total beginners poking around for the first time, which is exactly the kind of onchain analysis this guide is about.
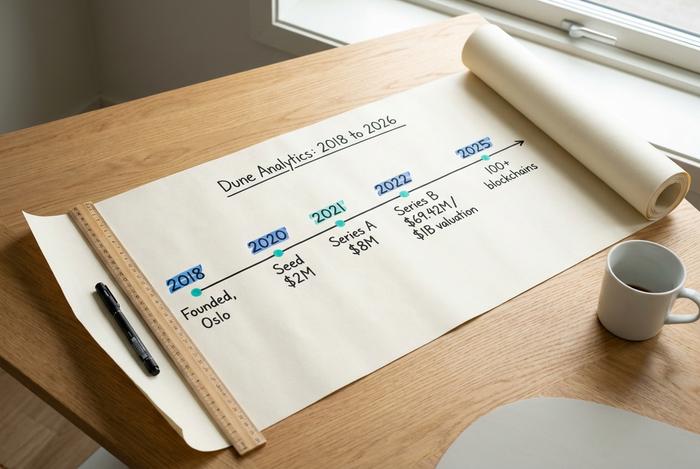
The origin story is a good one. Fredrik Haga and Mats Olsen started Dune in Oslo back in 2018, and as the legend goes, they got turned down by more than a hundred investors first. Then it clicked. A $2 million seed landed in 2020, an $8 million Series A in 2021, and a $69.42 million Series B in February 2022 that priced the company at around $1 billion. Two people in Oslo, a crypto unicorn in four years. Total raised is roughly $79 million, with nothing new since that 2022 round.

How Dune Analytics Works Under the Hood
Dune has three moving parts: the data, the queries, and the people who do the hard work. Understand those three and the whole platform makes sense.
From raw blockchain to readable tables
A blockchain stores transactions, not tidy spreadsheets. The raw record is a stream of encoded calls and event logs that mean nothing until they are decoded against each contract's structure. Dune does that unglamorous middle step. It pulls data from each chain, decodes it, and organizes it into ordinary database tables you can search with SQL. Raw tables hold the unprocessed transactions and logs; decoded tables turn them into readable rows like "this wallet swapped this token."
The query engine, DuneSQL, is built on a fork of Trino, an open-source engine made for querying huge datasets fast. On top of that sits Spellbook, an open-source library of community-maintained data models, so common things like all Uniswap trades are already cleaned up and standardized. That matters because it means you rarely start from zero. Someone has usually already done the messy work of turning raw logs into a sensible table, and you just build on top.
Queries, dashboards, and visualizations
Once the data is in tables, you ask questions with SQL. A query might count daily active wallets, sum a protocol's fees, or track how a token's holders change week by week. You turn the result into a chart, table, or counter, and a group of those becomes a dashboard. Queries can take parameters, so a single dashboard can let viewers type in a wallet address or pick a token and see the numbers update.
The part beginners love is forking. Every public query and dashboard can be copied with one click. You find something that almost does what you want, fork it, and change a few lines instead of starting from scratch. Most people learn Dune this way, by taking apart work that already runs rather than writing SQL from a blank page.
The wizard community
Dune sorts its users into a loose pyramid. Most people just view dashboards. Some write their own queries. At the top sit the "wizards," the power users who publish the dashboards everyone else relies on. That community is the real engine, and it is why Dune feels less like a product and more like a shared public resource. A good wizard earns reputation and visibility when their dashboards get forked and embedded across the industry, which keeps fresh work flowing in without Dune having to build it all.
The scale shows the model works. The platform now hosts more than 200,000 dashboards, over 1.5 million datasets, and more than 6.5 million queries, covering 100-plus blockchains as of early 2025, from Ethereum and Bitcoin to Solana and Polygon.
| Dune at a glance | Detail |
|---|---|
| Founded | 2018, Oslo, Norway |
| Founders | Fredrik Haga (CEO), Mats Olsen (CTO) |
| Blockchains covered | 100+ (as of early 2025) |
| Public dashboards | 200,000+ |
| Total funding | ~$79 million (Series B, 2022) |
How to Use Dune Analytics: A Step-by-Step Start
Here is the good news for non-coders: you can get real value on day one without writing anything. The floor is "browse a dashboard," the ceiling is "write your own SQL," and AI now helps bridge the gap.
Step 1: read an existing dashboard
Start with a free account. Then search. Type a token, a protocol, or a plain topic like "Ethereum gas" or "stablecoin supply," and you will almost always land on a dashboard someone already built and keeps updated. Open it. Read the charts. Where the creator left filters open, change the date range or punch in a wallet and watch the numbers move. No SQL anywhere in this step. For a lot of beginners this is the whole job, because the question that brought you to Dune is usually already answered on someone else's dashboard, for free.
Step 2: write your first query
Eventually you will want something nobody has built. That means the query editor and a bit of SQL. SQL is just the language databases speak, and the basics take maybe two weeks to get comfortable with. Your first query will be short: pick a table, filter by a date or an address, count or sum a column. The genuinely hard part is not the syntax. It is knowing which table holds what you need, and that is exactly what Spellbook's ready-made models solve.
You also do not have to start cold. Dune's Wand AI tools, launched in 2023, can write a query from a plain-English prompt, edit one you already have, and debug errors. Dune says its Debug feature fixes around 90% of common syntax mistakes. So the modern path runs backwards from the old one. Describe what you want in English, let the AI draft the SQL, then tweak it. You learn by editing, not by memorizing.
Step 3: build and publish your dashboard
Now make it yours. Run the query, choose a chart type, and pin it to a fresh dashboard. Add a few more and you have a live view that refreshes in near real-time as new blocks land. Drop in some text, rearrange the layout, even embed a chart on your own site. Hit publish and it joins Dune's public library, where the next person can fork your work exactly like you forked someone else's. Every dashboard becomes raw material for the next one. That loop is why the platform keeps compounding.
What You Can Track with Dune Analytics
The reason people keep coming back is that Dune answers questions a price chart cannot. Heading into an airdrop, you can check whether a wallet actually qualifies instead of trusting a rumor on social media. You can follow large wallets to see what the so-called smart money is buying or selling before the news catches up.
For DeFi, you can pull a protocol's real trading volume, fees, and active user counts, so you can tell a genuinely busy app from a quiet one wearing a big logo. That distinction matters: plenty of tokens market themselves on hype that the on-chain numbers do not support. NFT collectors track mints and floor activity, traders watch exchange inflows and outflows, and analysts follow stablecoin supply across chains like Ethereum and Solana. If a number lives on-chain, someone has probably already charted it on Dune, and if they have not, you can.
Dune Analytics Pricing and Free Plan
For a beginner, the honest answer is that the free plan is enough. Dune runs on credits, which measure how much computing a query uses. The free tier gives you a monthly credit allowance that covers casual exploring and learning. You pay when you need more credits, faster execution, or private queries that the public cannot see.
| Plan | Price | Monthly credits | Best for |
|---|---|---|---|
| Free | $0 | 2,500 | Learning, browsing, light querying |
| Analyst | $75/mo | 4,000 | Regular individual analysts |
| Plus | $399/mo | 25,000 | Teams, private queries |
| Enterprise | Custom | Custom | Funds, companies, API access |
Prices and credit limits shift over time, so check the current Dune pricing page before you upgrade. Most people never need to.
Dune Analytics vs Nansen and Other Tools
Dune is not the only on-chain analytics tool, and it is not always the right one. The simplest way to think about it: Dune is the do-it-yourself option. You get raw flexibility and a free tier, but you do the building. Nansen takes the opposite approach, selling labeled wallets and polished dashboards so you can skip the SQL. Flipside offers analytics and sometimes pays users to write queries, and Artemis focuses on clean cross-chain metrics.
| Tool | Model | Strength | Cost |
|---|---|---|---|
| Dune | Open SQL + community | Flexibility, widest chains | Free tier, then credits |
| Nansen | Curated wallet labels | Ready-made "smart money" views | Paid |
| Flipside | Analytics + rewards | Earn while querying | Free to use |
| Artemis | Cross-chain metrics | Clean comparison data | Free + paid tiers |
There are others worth knowing too. Arkham focuses on identifying and tracking entities behind wallets, and Glassnode leans toward Bitcoin and market-wide on-chain indicators. None of them makes Dune redundant, because Dune's open SQL model lets you build anything the others have not thought to package yet.
So the choice comes down to effort versus control. If you want polished answers without coding, a labeled tool like Nansen may save you time and is worth paying for. If you want to ask your own questions, see exactly how every number was calculated, and pay nothing to start, Dune wins. Many serious analysts simply use both.
Is Dune Analytics Worth It in 2026?
One honest caveat, because the platform is shifting fast. In March 2026 Dune shipped Dune MCP, a way to pipe its on-chain data straight into AI agents, and the CEO has been blunt about going "all-in on AI and institutions." That bet came with a human cost. Dune cut about 25% of its staff, roughly 35 people, in May 2026. So what does MCP actually mean for you? Basically, an AI assistant can now pull live Dune data and answer your question without you writing a single line of SQL, the same plain-English direction Wand pointed at first. The picture for a normal user is mixed. Dune is still the widest free window into on-chain data, but its roadmap clearly favors AI tools and big clients over hobbyists. None of that changes the free plan you can use today. The only real trap for a beginner is trusting a sloppy dashboard, so check who built the one you are reading before you act on it.
Should You Use Dune Analytics?
So, should you bother? If you hold crypto, trade it, or just want to know what is real, yes. Dune is the closest thing we have to a free, public window into on-chain activity, and you need neither a coding background nor a paid plan to look through it. Skip the urge to learn SQL first. Open a dashboard someone already built, fork it, change one number, and watch what happens. Once you can pull the on-chain data yourself, a lot of those confident crypto Twitter threads start to look very different.


