Liquidity Sweep in Trading: How to Identify and Trade It
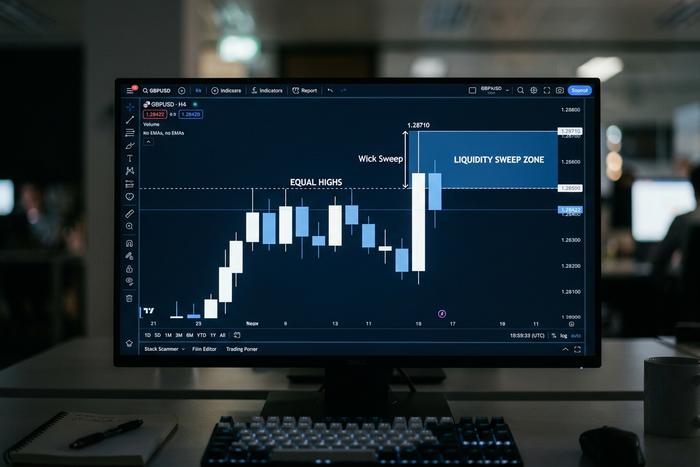
A trader watches GBPUSD print four equal highs at 1.2680 over the course of two London sessions. Every retail breakout buyer who stops out short above the figure has the same stop-loss order resting in the same shallow area. So does every breakout trader waiting to go long on the next break above 1.2680. The next morning, in two minutes, price tags 1.2683, fills every one of those orders, then collapses 40 pips back through the entire range. The breakout buyers are stopped out instantly. The market reverses and trends down for the rest of the day. That is a liquidity sweep, and it is one of the cleanest patterns in the Smart Money Concepts trading vocabulary.
This guide explains what a liquidity sweep actually is, how to identify it on a chart, how it differs from a liquidity grab and a liquidity run, and how to trade liquidity sweep setups with concrete entry, stop loss, and take profit rules. The intent is to trade liquidity the way professional desks treat it, not to chase wicks. It also covers where the edge holds and where it does not.
What Is a Liquidity Sweep? A Quick Definition
A liquidity sweep occurs when a sharp price movement runs through a price level that holds a large cluster of pending orders placed by retail traders and other market participants, fills those orders, and then reverses direction. Institutional traders and market makers, the large market participants who actually move prices, use the resulting volume to fill positions that would otherwise cause slippage. The clusters live where retail traders predictably place their stop losses and pending orders. Above an obvious swing high. Below an obvious swing low. At a round psychological number. At equal highs or equal lows that have held for a while. A sweep is a short, often violent move that takes those orders, gives institutional desks the volume they need to fill large positions, and then reverses direction. The pattern is the same in every market that produces continuous candles.
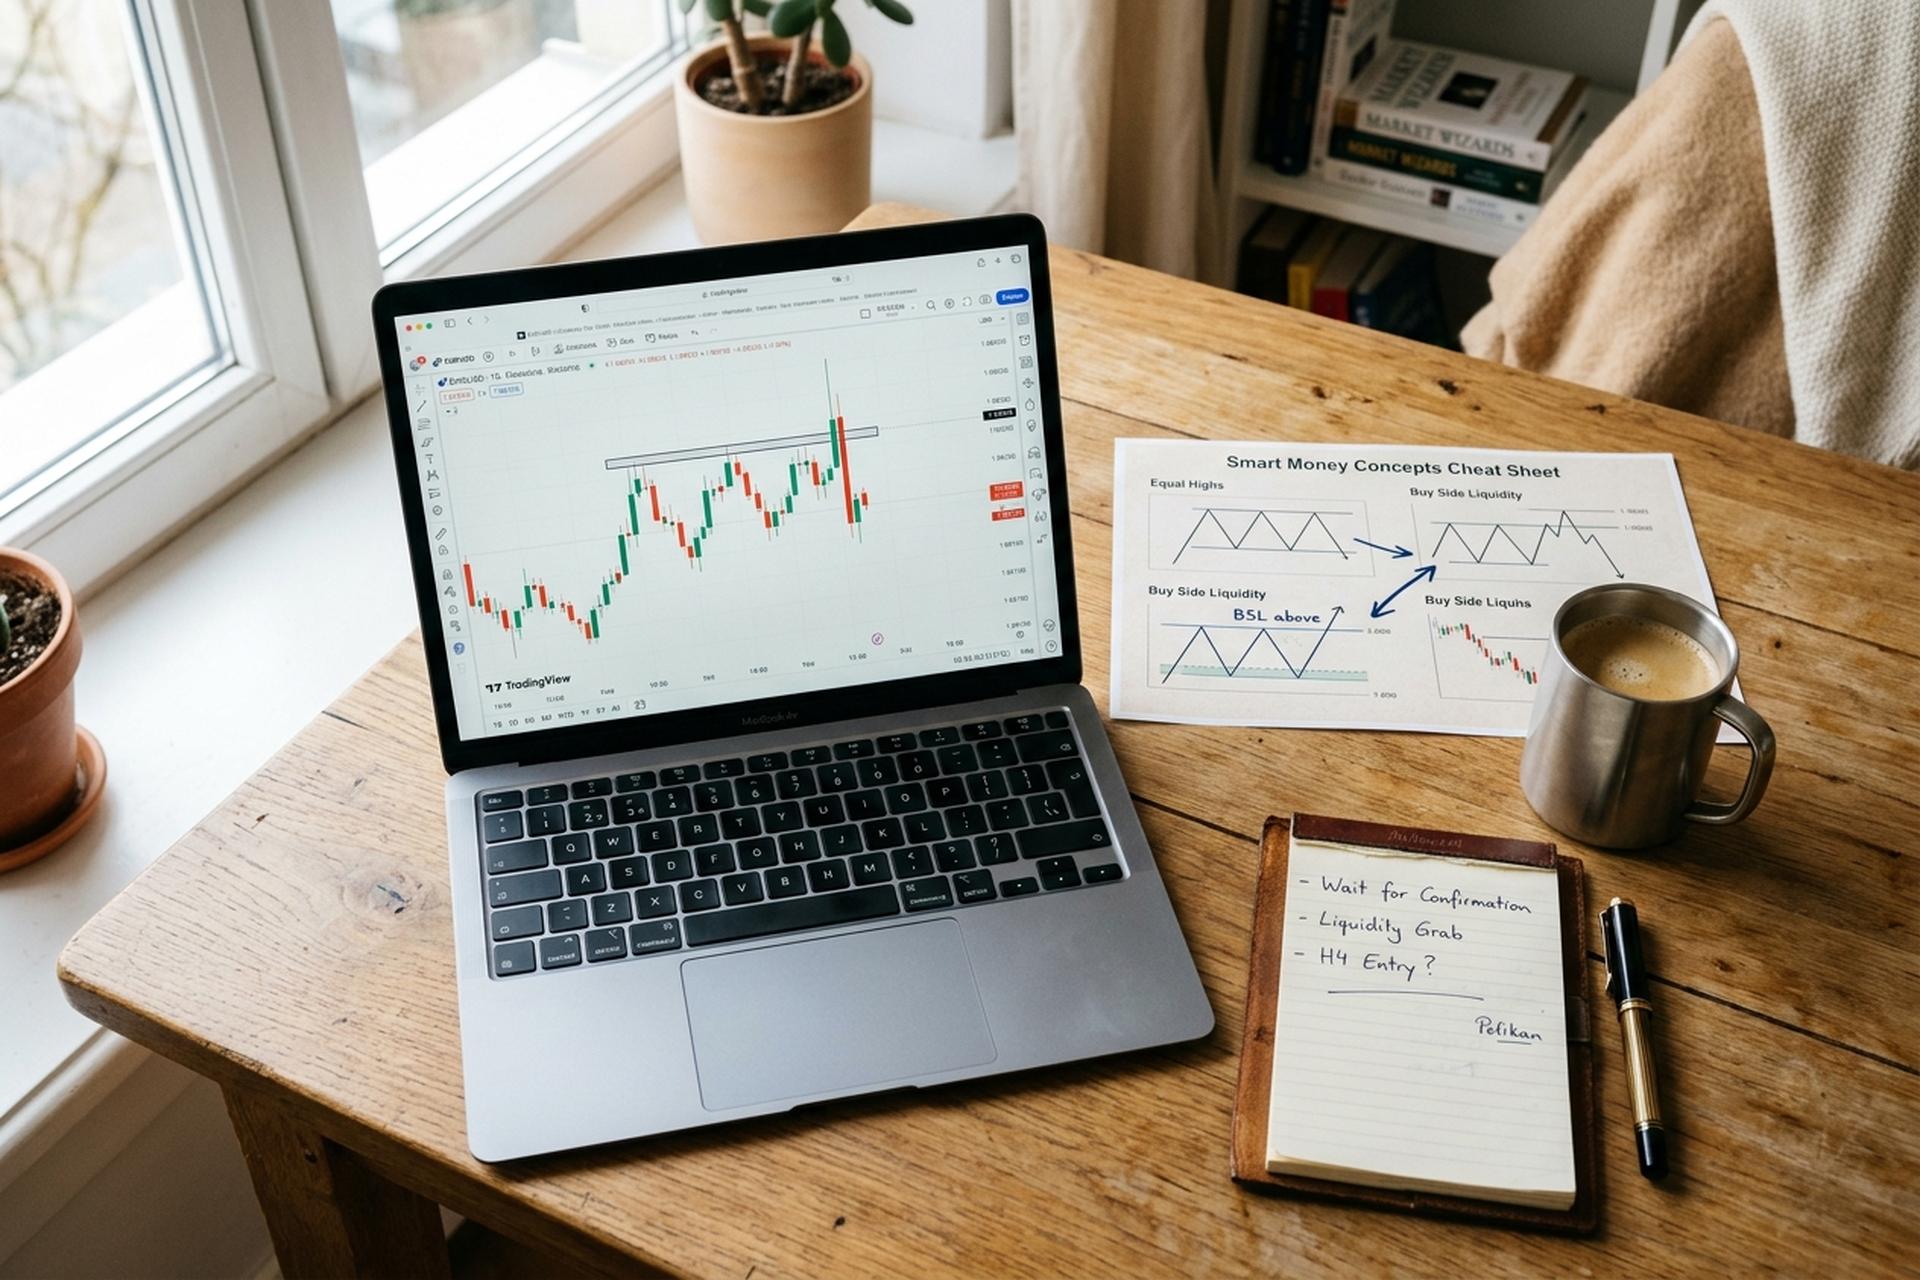
Buyside vs Sellside Liquidity in the Smart Money Concept
The Smart Money Concept (SMC) framework divides resting liquidity into two halves.
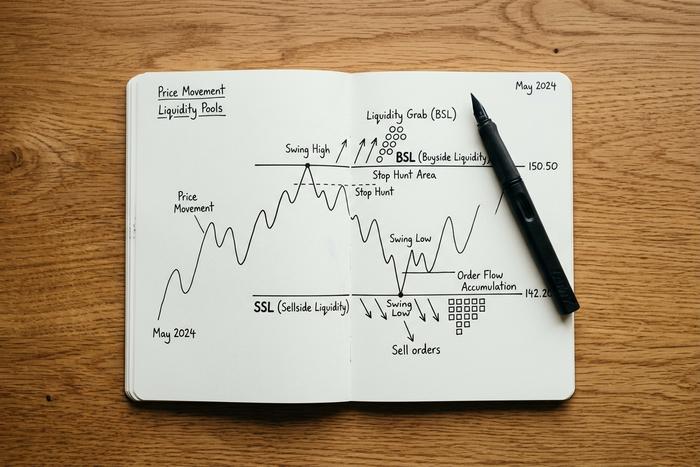
Buyside liquidity (BSL) sits above price. It is the stack of pending buy-stop orders held by short sellers protecting their positions, plus the breakout buy orders waiting for a clean push higher. When price runs through BSL, those buy orders fill, which gives an institutional seller the volume needed to dump a large short position into the market without slippage.
Sellside liquidity (SSL) sits below price. It is the mirror. Stop losses from long positions, plus the short-side breakout orders waiting for a clean push lower. When price runs through SSL, the sell-stops trigger, and an institutional buyer absorbs that volume to fill a large long entry.
This is not theoretical. The New York Federal Reserve published a 2002 staff report (Osler, Staff Report No. 150) showing that stop-loss orders cluster predictably around round numbers in FX, and that price runs through those clusters more often than chance would predict. The mechanics that ICT traders describe with the SMC vocabulary have an academic anchor.
The same logic applies to BTC, ES, NQ, and every liquid forex pair. Price hunts the cluster. The cluster fills the institutional order. The market then trades to the opposite side, where the next cluster of liquidity is waiting.
How to Identify a Liquidity Sweep on the Chart
Identifying a liquidity sweep is about three things. The location of the cluster, the speed of the wick, and the close of the candle that did the sweeping.
The first piece of work is finding the liquidity zone. The eye looks for swing highs or lows that have held twice or three times. Equal highs and equal lows are the strongest. Price respecting the same level repeatedly creates a self-reinforcing cluster of stops above or below it. Round numbers like 1.0000 in EURUSD or $100,000 in BTC concentrate the same stops for the same psychological reason. So do the high and low of the prior trading day, the prior week, and the Asian session range during the London open.
The sweep itself is recognizable by texture. Price drives through the level on a single fast candle, often producing a long wick. The high or low of the candle prints beyond the cluster. Then the close prints back inside the prior range. A bullish-style candle with a long upper wick that closes near its open. A bearish-style candle with a long lower wick that closes near its open. The wick is the evidence that the cluster filled. The close back inside is the evidence that the move was not a real breakout.
A confirmed sweep also produces a market structure shift on the next two or three candles. Price breaks the most recent opposite-direction swing in the lower timeframe, which is the SMC change of character (CHoCH). Without that follow-through, a sweep candle is just a wick. With it, the trade thesis is alive.
A liquidity sweep pattern that prints without structural confirmation is a setup not to take. Most retail traders take every wick they see and lose money. The price action sequence that helps traders identify liquidity reliably is the level, the wick, and the structure shift, in that order.
Liquidity Sweep vs Liquidity Grab vs Liquidity Run
Three terms get used interchangeably in casual SMC content, and the distinctions matter when reading mentor material.
| Concept | Scale | Behavior | Typical use |
|---|---|---|---|
| Liquidity sweep | Local, intraday | Wick through cluster, fast reversal | Swing/intraday entry on reversal |
| Liquidity grab | Smaller, often single candle | Quick wick, immediate snap-back | Scalping entries |
| Liquidity run | Larger, multi-candle | Trend extension that exhausts at the end | Trend continuation, then reversal |
A sweep and a grab are mechanically close. The difference between a liquidity sweep and a liquidity grab is mostly scale and timeframe. A sweep moves a wider range and prints on a higher timeframe, often the 15-minute or 1-hour. A grab is faster and narrower, often a 1-minute or 5-minute event. A liquidity run is the broader market move that exhausts into the sweep. In practice, traders treat them as variations of the same idea, but knowing which one is on the chart keeps the position size sensible.
Trading Strategies: Entries, Stop Loss, Take Profit
A working liquidity sweep trading strategy comes down to four rules. Each rule has a clean answer.
Rule 1: Higher-timeframe context first. Work on the 1-hour or 4-hour chart to identify the dominant trend and the obvious liquidity zones above and below current price. Drop down to the 15-minute or 5-minute chart only after the higher-timeframe map is set. Trading sweeps without trend context produces noise.
Rule 2: Wait for the sweep, then the structure shift. A trader does not enter on the sweep candle itself. The thesis requires the wick through the level and a confirmed market structure shift on the lower timeframe. Most failed sweep trades happen because the trader pulled the trigger on the wick and got run over by the next candle.
Rule 3: Stop loss beyond the swept level. For a buyside liquidity sweep that becomes a short setup, the stop sits above the high of the sweep candle, with a small buffer of 2 to 5 pips. For a sellside sweep that becomes a long setup, the stop sits below the low of the sweep candle. The level either holds or it does not. If price closes back through it, the thesis is wrong and the trade is invalidated.
Rule 4: Profit targets at structural liquidity, not arbitrary numbers. The most natural targets are the next opposing liquidity pool. After a buyside sweep that flips the chart bearish, the target is the previous swing low or the equal lows below price. A 1:2 minimum risk-to-reward filter is standard. A 1:3 or better is the setup worth holding for. Anything tighter is usually a sign of forcing a low-quality trade.
Entry timing inside the structure shift is a question of style. Aggressive traders enter on the close of the first candle to break structure, accepting wider risk and a higher win rate. Conservative traders wait for a small pullback into the displacement candle's fair value gap and enter from there, with a tighter stop and worse fill rate. Both are valid. Pick one and be consistent.
Liquidity Sweep + FVG + Order Block: The ICT Combo
The cleanest sweep setups stack three patterns. The sweep is the catalyst. The fair value gap is the entry zone. The order block is the structural backstop.
A typical sequence on the 15-minute EURUSD looks like this. Price prints equal highs at 1.0950 over the New York session. The next morning, during the London-New York overlap, a single candle wicks up to 1.0954 and closes at 1.0942. That is the sweep. Two candles later, price prints a strong bearish candle that breaks the prior swing low, leaving a fair value gap between candle 1 high and candle 3 low. Inside that bearish candle, the previous bullish candle is the order block. The trade is a short on the retracement into the fair value gap, with stop above the 1.0954 sweep high, target at the next sellside liquidity below, often the low of the prior trading session.
The reason this combo works is the sequencing. The sweep takes the obvious retail liquidity. The structure shift removes any last reason to think the breakout was real. The FVG retrace gives the institutional desk a clean entry. The order block defines the line in the sand. A trader who waits for all four pieces takes far fewer setups but lands on the highest-probability ones. The ICT 2022 mentorship material formalized this combination as the core repeatable model.
Liquidity Sweep in Forex, Crypto, and Indices
Liquidity sweeps form on every continuous-candle market, but the texture varies.
Forex sweeps on majors like EURUSD, GBPUSD, and USDJPY are the cleanest. The Bank for International Settlements 2022 Triennial Survey put global daily FX volume at $7.5 trillion, with roughly 88% of trades touching the US dollar. The cleanest sweeps print at the London open, the New York open, or during the overlap, when institutional desks are actively positioning. Asian-session sweeps tend to be smaller and less reliable.
Crypto sweeps on BTC and ETH perpetual futures run around the clock. The texture differs because there is no session reset. Liquidity rebuilds constantly, and round-number levels like $100,000 BTC become repeat targets. The 2024 yen carry trade unwind showed how fast a sweep can become a multi-week trend, when the Nikkei 225 fell 12.4% in a single session, the steepest drop since 1987.
Index futures, particularly the ES and NQ on CME, produce sweeps around US session opens, FOMC announcements, and CPI prints. The CME Group reports daily volume in the tens of millions of contracts across the equity index complex. The macro releases are reliable sweep catalysts because they create the volatility that runs the stops.
Risk Management for Sweep Reversals
Risk management is what separates a working liquidity sweep strategy from a destroyed account. Three rules apply.
First, fixed risk per trade. One percent of account equity per setup is the standard ceiling. A trader who takes 30 sweep trades at 1 percent risk and wins half at 1:3 R:R is up roughly 30% before fees. A trader who takes the same 30 trades at 5 percent risk has destroyed the account on the first three losers.
Second, sweep trades fail fast or pay fast. If the sweep was real, the reversal moves cleanly within the first 30 minutes on the entry timeframe. If it stalls, exit early. The setup loses its edge once price consolidates inside the swept level instead of trending away from it.
Third, do not stack sweep trades. One position per liquidity zone. Layering longs on the same sellside sweep multiplies the loss when the level fails, without giving more upside if the trade works. A trader who treats each sweep as a single shot trades less and earns more.
Limitations: Do Liquidity Sweeps Actually Work?
The honest answer is that liquidity sweeps work as part of a system, not as a standalone signal. The Osler 2002 New York Fed paper provides academic support for the underlying phenomenon of stop-loss clustering and run-through behavior in FX. The structured ICT framework that turns the observation into a trading strategy, however, has been criticized for being unfalsifiable. Rules can be reinterpreted after the fact. Independent reviews of ICT-themed prop firm challenges show high failure rates among traders who treat the methodology as a recipe rather than a vocabulary.
The criticism worth taking seriously is that retail traders who study ICT often fail to integrate basic risk management with the framework. The pattern recognition is the easy part. The trading discipline is what determines whether the strategy is profitable. Working sweep traders are the ones who treat each setup as one of many, manage position size strictly, and skip the vast majority of setups that look like sweeps but lack structure.
The framework is not magic. It is a vocabulary that helps a disciplined trader name what institutional flow is doing on the chart and trade it with clean rules. That is genuinely useful. It is not a shortcut.
Final Thoughts on Trading Liquidity Sweeps
A liquidity sweep is a name for a specific shape of order-flow event that can help traders read why price moves the way it does at key levels. Resting orders cluster, price moves quickly through them, the cluster fills, and the market then prints a clear reverse direction. The pattern is real, the academic literature supports the underlying mechanic, and traders who learn to read it gain a useful piece of vocabulary. The traders who actually make the strategy pay are the ones who treat the sweep as one component of a larger checklist that includes higher-timeframe context, structural confirmation, fair value gap entry, and strict risk management. Build the checklist. Trade the checklist. Skip every sweep that does not pass it.


