Fair Value Gap Trading: A Complete FVG Strategy Guide

A trader watches the 15-minute EURUSD chart on a Tuesday morning. Three candles form in quick succession. The first closes at 1.0820 with a high of 1.0822. The second is a strong bullish marubozu running from 1.0822 up to 1.0855. The third opens at 1.0853 and prints a low of 1.0851. Between the high of the first candle (1.0822) and the low of the third (1.0851) sits an empty 29-pip zone where, in technical terms, no two-sided trading happened. That zone is a fair value gap. Smart Money Concepts traders treat it as a magnet, expecting price to return to it before continuing in the direction of the impulse.
FVG-based trading strategies use FVGs to help traders read where supply and demand have temporarily broken down. This guide explains what a fair value gap is, how to identify one in three candles, how to trade bullish and bearish FVGs with concrete entry, stop-loss, and take-profit rules, and where the FVG sits inside the broader Inner Circle Trader (ICT) and SMC framework. It also looks honestly at where the edge holds and where it does not.
What Is a Fair Value Gap? FVG Definition Explained
A fair value gap, often shortened to FVG, is an area on a price chart where price moves so quickly in one direction that it leaves an imbalance behind. The mechanism is simple. Buyers and sellers stop meeting in the middle, one side overwhelms the other, and the candle range expands fast enough that not every price level inside the move gets traded against opposing orders.
The FVG concept entered modern retail trading vocabulary through Michael J. Huddleston, who teaches under the name Inner Circle Trader. Huddleston released his ICT Mentorship in 2016 and 2017 on YouTube, where his channel has grown into the millions of subscribers. The fair value gap, sometimes called an imbalance, an inefficiency, or a price imbalance, is one of the foundational pieces of his framework alongside order blocks and liquidity sweeps. The term has since spread far beyond his audience and become standard vocabulary in Smart Money Concepts circles.
Fair value gaps are not the same as the regular price gaps a stock trader sees on a Monday open after weekend news. Regular gaps are between sessions. FVGs form intraday, inside continuous price action, on every timeframe from 1-minute up to monthly.
How to Identify a Fair Value Gap on a Chart
Identifying an FVG on a chart is a three-candle exercise. The pattern is mechanical, the rules do not change across markets, and a trader can scan a chart for FVGs in seconds once the eye is trained.
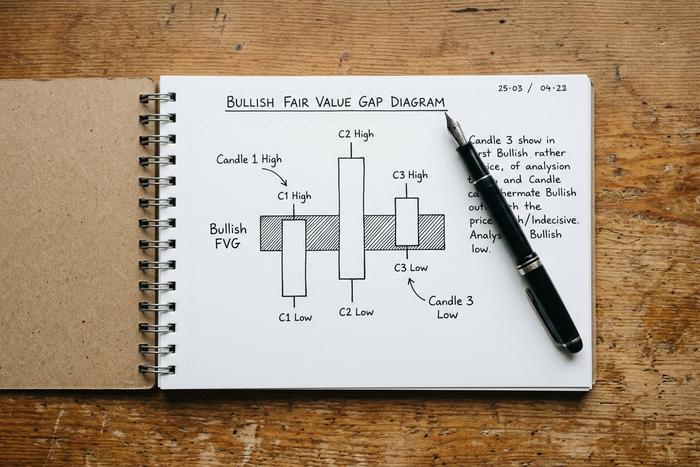
Take any three consecutive candles. Call them candle 1, candle 2, candle 3. The FVG sits in the gap between the wick of candle 1 and the wick of candle 3, and it only exists when candle 2 is a strong directional move that opens that space.
For a bullish FVG, the rule is plain. The low of candle 3 must be higher than the high of candle 1. The space between them is the gap.
For a bearish FVG, the rule reverses. The high of candle 3 must be lower than the low of candle 1. The space between them is the gap, and price tends to revisit it on the way down.
Two practical filters separate noise from signal. First, candle 2 should be a clear impulse, ideally a marubozu or a body that dominates the recent range. Second, the FVG should sit at a meaningful structural level. An FVG inside choppy consolidation rarely holds. An FVG that prints right after a break of structure is a different animal.
Bullish FVG vs Bearish FVG: 3-Candle Patterns
The two FVG variants reflect the two sides of the same imbalance.
| FVG type | Where it forms | Trade direction | Where the gap sits |
|---|---|---|---|
| Bullish FVG | After a strong upward impulse | Long, on retracement into gap | Between high of candle 1 and low of candle 3 |
| Bearish FVG | After a strong downward impulse | Short, on retracement into gap | Between low of candle 1 and high of candle 3 |
Bullish FVGs typically appear during expansive rallies in trending markets. The candle 2 body opens deep into bid liquidity, the move runs, and the next candle opens above where buyers were active. Bearish FVGs are the mirror. A heavy sell candle drives through bid stacks, candle 3 prints below where the action started, and the gap sits above the new lows.
The FVG itself is a passive piece of chart geometry. It does not predict direction on its own. What gives it edge is the combination of the imbalance with the broader market structure, which is the next piece.
Fair Value Gap Trading Strategy: Entries and SL/TP
A workable FVG trading strategy comes down to four rules. Each rule has a clean answer.
Rule 1: Trade with the trend. Buy bullish FVGs in clear uptrends. Sell bearish FVGs in clear downtrends. The exception is reversal trades, which require a confirmed market structure shift first.
Rule 2: Wait for retracement into the gap. Do not chase the impulse candle. The trade lives on the pullback, not on the breakout. Price returning to the FVG is what creates the entry.
Rule 3: Place the stop-loss order beyond the gap. For a bullish FVG entry, the stop sits below the low of candle 1. For a bearish FVG entry, the stop sits above the high of candle 1. The gap itself becomes the line in the sand. If price closes through it, the imbalance was filled and the trade idea is invalidated.
Rule 4: Take profit at structure, not at fixed targets. The most common targets are the prior swing high (for longs), the prior swing low (for shorts), or the next obvious liquidity pool above or below price. A 1:2 or 1:3 risk-to-reward on the entry is a reasonable filter for whether the setup is worth taking.
Entry timing inside the gap is a question of style. Aggressive traders set a limit order at the midpoint of the FVG to get filled deeper into the imbalance. Conservative traders wait for a lower-timeframe change of character (CHoCH) to confirm the bounce before clicking buy or sell. Both work. The aggressive entry has tighter risk and worse fill rate. The conservative entry has wider stops and higher win rate. Pick one and be consistent.
Inverse Fair Value Gaps (IFVGs) and Reversal Logic
An inverse fair value gap is what happens when an unfilled FVG fails. Price closes through the gap in the opposite direction of the impulse, and the zone flips its bias.
A bullish FVG that gets cleanly broken below becomes an inverse bearish zone. When price retraces back up to it, the same pixels on the chart now act as resistance. The mechanism is liquidity. Traders who entered long inside the original FVG are now underwater, and the zone above price has a stack of stops. A retracement into it triggers those stops and gives the new short trend fuel.
The IFVG entry is, mechanically, the mirror of the standard FVG entry. The trade direction has flipped. A trader looking for IFVGs is looking for failed bullish gaps in a developing downtrend, and failed bearish gaps in a developing uptrend. Combined with a clean break of structure, IFVGs are one of the cleaner reversal setups in the SMC playbook.
FVGs in Smart Money Concepts: Order Blocks, BOS, CHoCH
The fair value gap is one piece of a larger framework. Trading it without context is the most common reason FVG strategies fail.
The Smart Money Concepts vocabulary names a small set of price-action patterns. Order blocks are the last opposite-direction candle before an impulse, treated as institutional accumulation or distribution zones. Break of structure (BOS)is when price closes through a prior swing high in an uptrend or a prior swing low in a downtrend, confirming trend continuation. Change of character (CHoCH) is the first opposite move that breaks the prior swing in the other direction, signaling a possible trend shift. Liquidity sweeps are wicks that take out a recent high or low before reversing, typically to grab stop-loss orders before the real move begins.
The FVG ties these together. The cleanest setup looks something like this. A liquidity sweep takes out a recent high. Price reverses sharply, printing a market structure shift. Inside that reversal candle sequence, an FVG forms. Price retraces into the FVG. The trader enters short, with stop above the swept high. The target is the next liquidity pool below.
This is not the only valid setup, but it is a common one. The key is that the FVG enters the trade thesis only after structure has confirmed direction. Without that confirmation, the FVG is just a hole in the chart.
FVG vs Order Block vs Liquidity Void
Three terms get used interchangeably in casual SMC content, and they should not. Each describes a distinct piece of market structure.
| Concept | Definition | Typical scale |
|---|---|---|
| Fair value gap | 3-candle imbalance, no opposing trade in between | Local, intraday |
| Order block | Last opposite-direction candle before a strong impulse | Local, holds across timeframes |
| Liquidity void | Multi-candle expansion zone with multiple FVGs inside | Larger, post-news or macro |
A trader can have an order block and an FVG stacked on top of each other on the same chart, and that confluence is exactly what high-probability setups look like. A liquidity void is the broader displacement that contains them. Knowing which is which keeps the analysis honest.
FVG Risk Management and Trading Plan
Risk management is what separates a working FVG strategy from a destroyed account. Three rules apply across all variations of FVG trading.
First, fixed risk per trade. One percent of account equity per setup is a common ceiling. Two percent is aggressive but manageable. Anything above that compounds losing streaks faster than the strategy can recover.
Second, predefined invalidation. The FVG either holds or it does not. If price closes through the gap against the trade direction, the thesis is wrong. Move on. Do not average down inside an invalidated FVG.
Third, the trading plan must specify which FVGs are tradeable and which are not. Most retail traders take every FVG they see and lose money. The four-rule filter from earlier covers trend alignment, retracement entry, structural context, and defined R:R, and it eliminates most of the noise. A trader who takes only the highest-quality setups will trade less and earn more.
Limitations: Do Fair Value Gaps Actually Work?
The honest answer is that fair value gaps work as part of a system, not as a standalone signal. The empirical literature on FVGs is thin. There are no peer-reviewed academic studies establishing a measurable FVG win rate, and the ICT framework as a whole has been criticized for being unfalsifiable, since rules can be reinterpreted after the fact.
What does exist is a mass of educator-published backtests showing that FVGs in trending markets, combined with structural confirmation, fill more often than chance and reverse from those fills more often than they break. The trading data platform edgeful has reported that intraday FVGs on major pairs remain unfilled more than 60 percent of the time within the same session, which is meaningful when paired with the right context.
The criticism worth taking seriously is that ICT methodology has produced large numbers of paid courses and few documented profitable retail traders. Independent reviews of ICT-themed prop firm challenges have shown high failure rates, although the same can be said of most retail trading methodologies. The framework is not magic. It is a vocabulary that helps a disciplined trader name what the chart is doing and trade it with rules. That is genuinely useful. It is also not a shortcut.
FVG Trading Across Forex, Crypto, and Indices
Fair value gaps form on any liquid market that prints continuous candles. The mechanic is the same. The texture differs.
Forex FVGs are the cleanest. Major pairs like EURUSD and GBPUSD trade through London and New York sessions with deep liquidity, and FVGs printed on the 15-minute and 1-hour charts during session opens have become a standard ICT-style setup. The Bank for International Settlements 2022 Triennial Survey put global daily FX volume at roughly $7.5 trillion, and the institutional flow inside that number is what creates the FVGs retail traders read on charts.
Index futures, particularly the ES (S&P 500 e-mini) and the NQ (Nasdaq-100 e-mini), produce FVGs around US session opens and during macro releases. CME Group reports daily volume in the tens of millions of contracts across its equity index complex, so the imbalances are real and frequent.
Crypto FVGs, on Bitcoin and Ethereum perpetual futures and spot, run around the clock without session breaks. That changes the texture. Crypto FVGs fill faster and more often than forex FVGs because liquidity is more fragmented and weekend volatility regularly tests imbalances that forex markets close through. Many ICT-trained crypto traders shift to higher timeframes (4-hour and daily) to compensate.
Final Thoughts on Trading Fair Value Gaps
A fair value gap is not a magic indicator. It is a name for a specific shape of imbalance that high-volume traders leave behind, and a trade thesis that prices return to that imbalance before continuing. It works when it is filtered by trend, structure, and risk management. It fails when it is taken as a standalone arrow on a chart. The traders who make the strategy pay are the ones who treat the FVG as the third piece of a four-piece checklist, not as the whole answer. Build the checklist. Trade the checklist. Skip every setup that does not pass it.


