Nominal vs Ordinal Data: Understanding the Key Differences
In this section, readers will learn what distinguishes nominal data from ordinal data, why these categories matter in modern data science, and how understanding their roles enhances accurate data analysis and statistical interpretation. You’ll discover how each data type influences measurement scales, see real-world examples of nominal and examples of ordinal variables, and understand their relevance in quantitative and qualitative data research.
Before we dive into definitions, it helps to set the stage for why this topic matters. In an era where businesses process trillions of data points daily, the way we classify data directly impacts our ability to make accurate decisions. This section introduces the fundamental distinctions between nominal data and ordinal data, both critical for statistical reasoning and data-driven insights.
Understanding Data Types
All data begins as unstructured information. Once organized through data collection, it becomes the foundation of modern data science. Data exists in numerous forms — binary (0s and 1s), text, images, or audio — and can be analyzed through both qualitative and quantitative data techniques. Recognizing the type of data helps determine the appropriate measurement scale and statistical methods to apply.
A growing number of analysts emphasize that knowing the data type is as crucial as the data itself. According to a 2025 PwC survey, 84% of data professionals reported that mislabeling data types leads to flawed analytics outcomes, reinforcing the need for proper data measurement practices.
Categorical and Quantitative Data
Data generally falls into two primary categories: categorical and quantitative.
- Categorical data (or qualitative data) describes characteristics such as color, gender, or brand preference. It includes nominal data and ordinal data.
- Quantitative data (or numerical data) involves measurable values and includes interval, ratio, discrete, and continuous data types.
Understanding the difference between nominal, ordinal, interval, and ratio data is key to performing correct statistical analyses and drawing valid conclusions.
Levels of Measurement: Nominal, Ordinal, Interval, and Ratio
Psychologist Stanley Smith Stevens defined the four levels of measurement still used today:
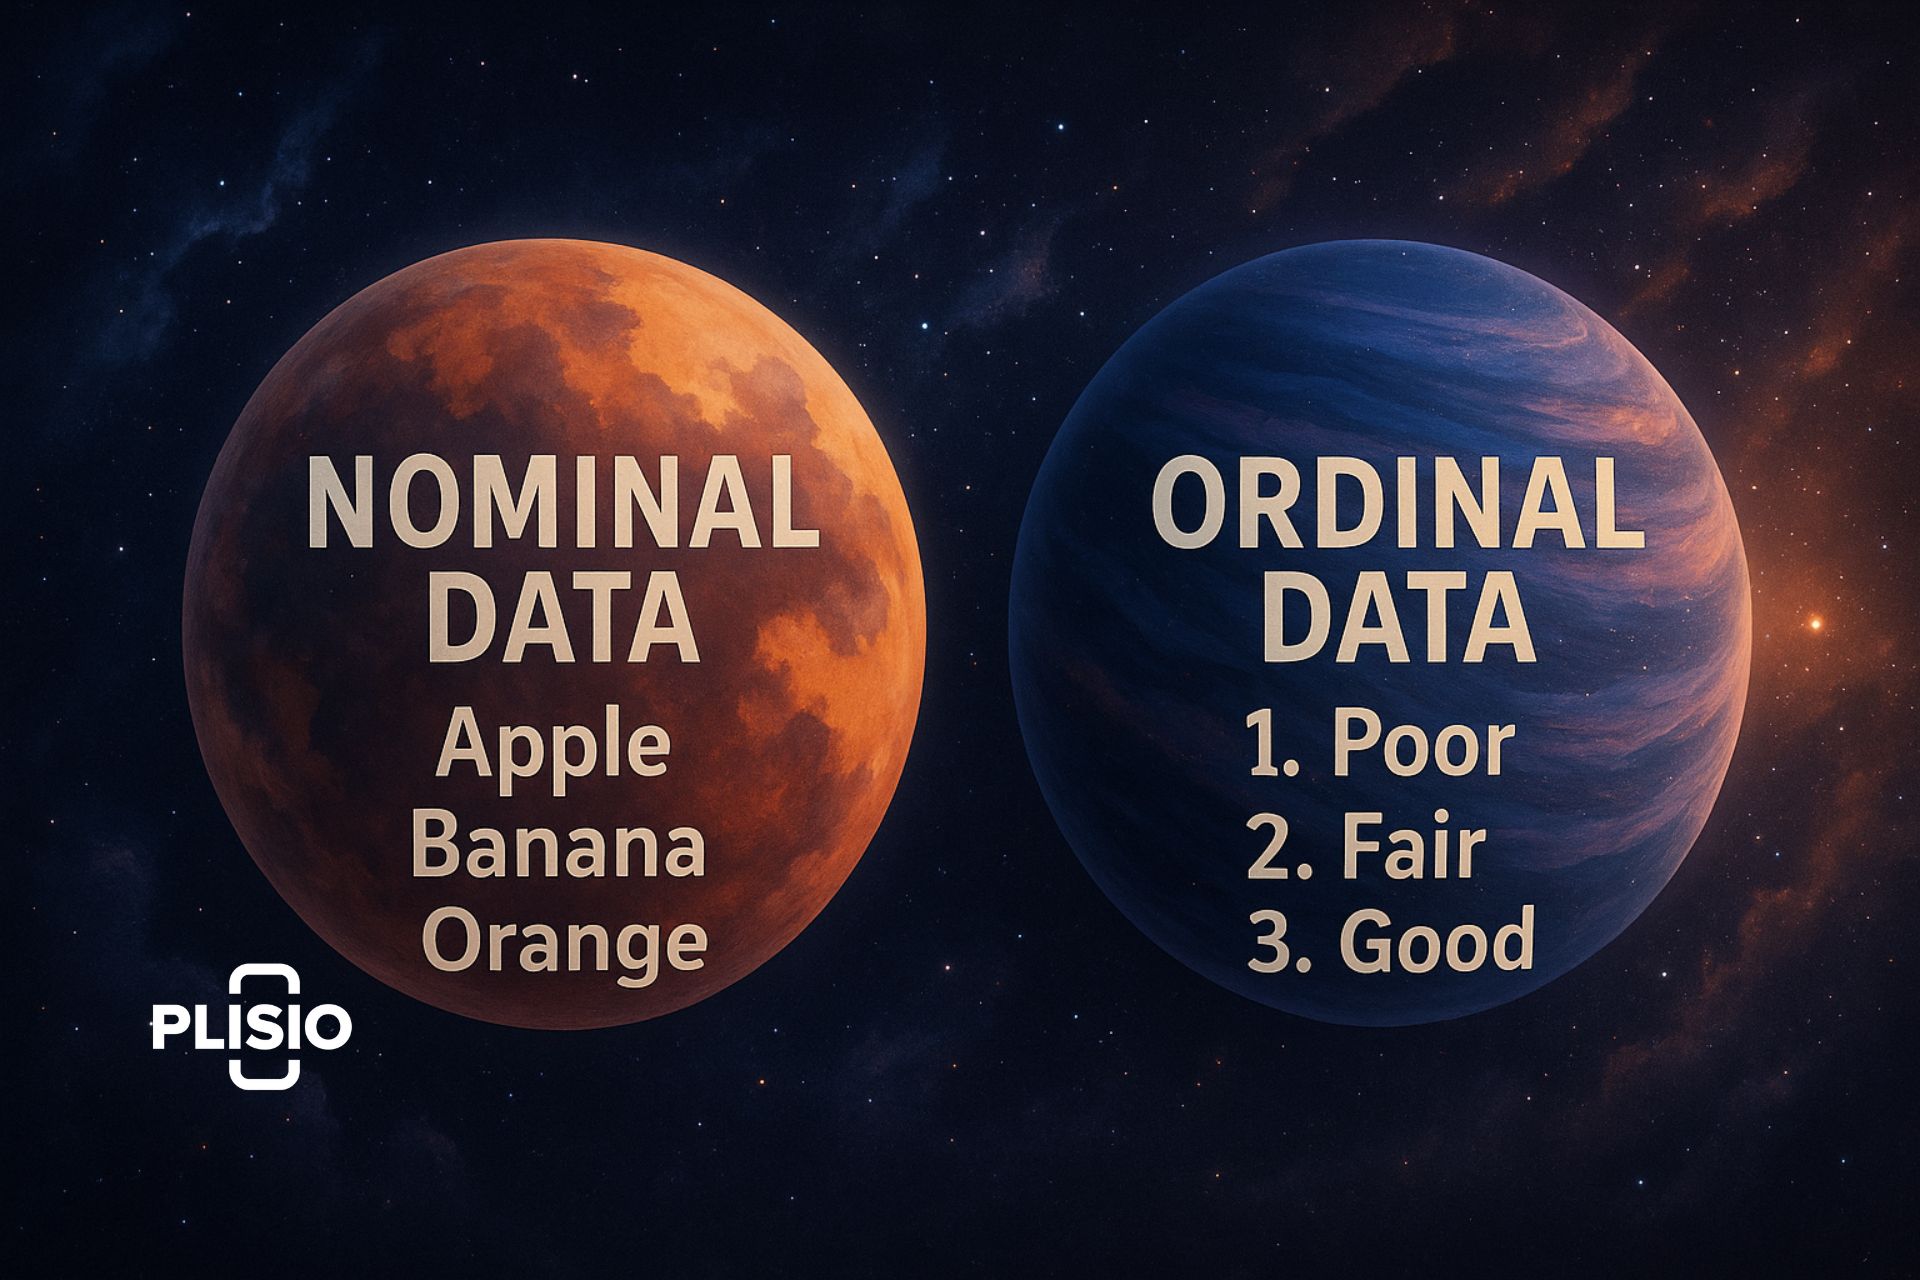
- Nominal Scale (Nominal Data): Categorizes without implying order. Examples of nominal data include gender, blood type, and country.
- Ordinal Scale (Ordinal Data): Orders categories meaningfully, such as education level or satisfaction levels, though the intervals between ranks may vary.
- Interval Scale (Interval Data): Deals with numerical variables measured along equal intervals but without a true zero (e.g., temperature in Celsius).
- Ratio Scale (Ratio Data): Features a true zero, allowing full mathematical operations. Examples include height, income, and duration.
Each measurement scale offers a unique lens for understanding data. Nominal and ordinal data belong to categorical data, while interval and ratio data fall under quantitative data.
Nominal Data Explained
Nominal data is a type of qualitative data used to classify information without order or ranking. This nominal level is common in marketing, research, and healthcare.
Examples of nominal data:
- Gender (male, female, other)
- Blood type (A, B, AB, O)
- Eye color (blue, brown, green)
- Customer segments (new, returning, premium)
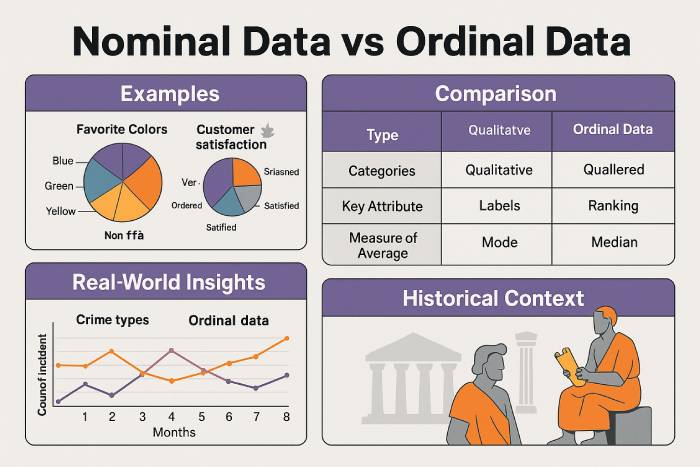
In data analysis, nominal variables are examined using mode and frequency counts. Bar charts and pie charts effectively represent this categorical data, helping visualize proportions and trends.
Ordinal Data and Its Importance
Ordinal data represents ordered categories — such as satisfaction ratings or performance ranks — where distances between values are not equal. This ordinal scale is often used in data collection techniques like surveys.
Examples of ordinal data:
- Education level (high school, bachelor’s, master’s, doctorate)
- Satisfaction levels (very dissatisfied → very satisfied)
- Economic class (low → middle → high)
In data analysis, ordinal data supports the use of medians, percentiles, and non-parametric tests. Visualizations such as ordered bar charts and dot plots clearly display ranked relationships. The key difference between nominal and ordinal data lies in order — ordinal data has it, nominal data does not.
Interval and Ratio Data: Quantitative Analysis
Interval and ratio data are the most precise quantitative data types.
- Interval data uses an interval scale with equal measurement gaps but no absolute zero (e.g., IQ, temperature).
- Ratio data operates on a ratio scale, where zero means the complete absence of a variable. Examples include income, weight, or distance.
Both data types allow for advanced statistical analyses such as mean, variance, and correlation — essential in descriptive statistics and predictive modeling.
Discrete vs Continuous Data
Quantitative data also divides into discrete and continuous data:
- Discrete data includes countable values like the number of customers or cars in a lot.
- Continuous data involves measurable values within a range, such as height or time.
Recognizing discrete vs ordinal data and discrete vs continuous data distinctions improves the accuracy of data analysis and ensures the right visualization methods are used.
Why Understanding Data Types and Levels Matters
The proper identification of nominal, ordinal, interval, and ratio data directly impacts the reliability of statistical analyses. Treating ordinal data as purely numerical or nominal can result in skewed insights. As Dr. Lisa Nguyen from the University of California notes, “Misinterpreting the data type is one of the silent causes of bias in machine learning models.”
A 2025 Deloitte study found that 71% of companies investing in data science initiatives reported measurable ROI improvements after training staff in data classification and measurement scale literacy. This highlights the growing demand for analysts proficient in data collection, categorization, and interpretation.
Expert Opinions and 2025 Perspectives
According to IDC (2025), global data generation surpassed 181 zettabytes, a 23% increase from 2024. Dr. Maria Chen of MIT states, “Recognizing nuances between nominal data and ordinal data goes beyond academia — it’s foundational to applied analytics.”
Dr. Rafael Torres of the European Institute of Data Science adds, “The future lies in hybrid data modeling — combining qualitative and quantitative data for richer behavioral insights.”
A Statista (2025) report revealed that 78% of organizations use data-driven decision-making, yet nearly half face misclassification issues. This demonstrates why mastering distinctions like nominal vs ordinal data, interval and ratio data, and discrete vs continuous data remains critical for modern analysts.
Visual Tables and Real-World Case Studies
| Data Type | Scale | Measurement Property | Example | Used In |
|---|---|---|---|---|
| Nominal Data | Nominal Scale | Categorical (No Order) | Gender, Eye Color | Market Segmentation, Surveys |
| Ordinal Data | Ordinal Scale | Ranked Categories | Education Level, Satisfaction | Customer Experience, Performance Reviews |
| Interval Data | Interval Scale | Equal Intervals, No True Zero | Temperature (°C), IQ | Psychology, Climate Studies |
| Ratio Data | Ratio Scale | Equal Intervals, True Zero | Height, Weight, Income | Finance, Engineering, Healthcare |
Real-World Analytics Case:
In 2025, a global retail chain used ordinal data from customer satisfaction surveys to predict churn rates. By analyzing satisfaction levels (from “very dissatisfied” to “very satisfied”), the company identified at-risk customer groups and reduced churn by 12% using predictive analytics models.
Another case from the healthcare sector involved ratio data. Hospitals tracked patient recovery times and used descriptive statistics to optimize staffing levels, cutting waiting times by 18%.
Historical Context
The concept of data classification dates back to the mid-20th century when psychologist Stanley Smith Stevens introduced the four levels of measurement in 1946. In 2025, his framework remains foundational in data science and statistical analysis, forming the basis for modern machine learning and AI-driven decision systems.
Modern experts emphasize that the historical roots of nominal, ordinal, interval, and ratio data continue to inform emerging technologies. As AI systems rely more heavily on data labeling and categorization, precise understanding of measurement scales ensures ethical and accurate model training.
Final Thoughts
The rise of data science has made the ability to correctly classify and interpret data more valuable than ever. Understanding nominal and ordinal data, as well as interval and ratio scales, is the foundation of accurate data analysis and credible statistical insights.
To elevate your analytical skills, explore new data collection techniques, apply rigorous data measurement principles, and continuously refine your ability to distinguish between qualitative and quantitative variables. The future of analytics depends on professionals who can transform complex statistical data into meaningful, actionable insights.

