Breaker Block Trading: The ICT Failed Order Block Strategy

On 6 October 2025, Bitcoin printed a new all-time high of $126,198. Four days later, $19 billion in derivatives positions were liquidated in a single session, and price was trading near $84,000 by the close of the week. By the time the dust settled, around $150 billion had been wiped from crypto derivatives across the year, according to CryptoSlate's review of CoinGecko data. Smart money concept (SMC) traders watching the daily chart had a shorthand for what happened: the bullish order block that defended the rally to the ATH failed, and on the first retest from below, the same zone acted as resistance instead of support. That flipped zone is what ICT methodology calls a breaker block. It is one of the cleanest trade ideas in retail technical analysis when it works, and one of the easiest to misread when it does not. The breaker block is a trading concept rooted in price action, market structure and smart money trading vocabulary.
This guide walks through what a breaker block actually is, the four-step sequence that creates one, the bullish and bearish setups with concrete entry, stop and target rules, and how the concept fits the volatility of the 2025-2026 crypto cycle. We will also be honest about the limits — ICT and SMC have their share of critics, and the breaker block is not magic.
What a breaker block is in ICT trading
A breaker block is, in plain language, a failed order block that flips polarity. An order block (OB) is the last opposing candle, or small candle cluster, before an impulsive move that breaks structure. Practitioners read it as the footprint of where institutions opened a position. When price returns to that order block and respects it, the trend continues. When price returns and breaks through the order block with a body close on the other side, that order block has failed. On the next retest from the opposite direction, the same level often acts as the new support or resistance. The failed level is the breaker block.
The concept comes from the Inner Circle Trader (ICT) methodology developed by Michael J. Huddleston, who began publishing the framework on YouTube around 2016. His ICT channel today carries roughly 1.6 million subscribers per Social Blade, and his X account (@I_Am_The_ICT) sits near 787,000 followers. ICT material has since been absorbed into the broader Smart Money Concepts label that dominates retail forex and crypto trading content. Whatever the umbrella, the breaker block is one of the most quoted ideas in the system.
The mechanic is rooted in something old. Traditional support and resistance flipping is a textbook concept: break support and it becomes resistance, and the other way round. The breaker block is the same idea expressed in the SMC vocabulary, with the additional ingredient that the broken zone is not just any swing level. It is the specific candle that institutions were assumed to have used to open a trade. When that order block fails, the working hypothesis is that those traders are now offside, and their stops will fuel the move in the new direction.
Two related ideas share the family. A mitigation block is an order block that price returned to and respected, where institutions partially "mitigated" their fills, the level held, and the trend continued. A breaker block is the opposite case, where the level failed and reversed. Treating these distinctions as crisp on every chart is harder than the literature makes out, but the conceptual line matters for trading decisions.
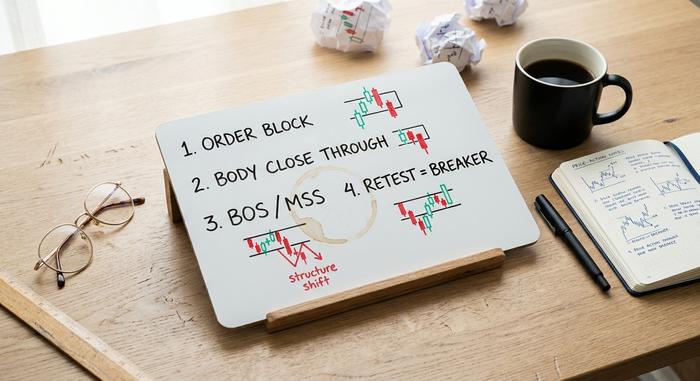
How a breaker block forms: a four-step sequence
The cleanest definition of a breaker block is procedural. It exists only after a specific four-step sequence resolves, and that sequence is identical whether you are trading EUR/USD or BTC perpetuals.
Step 1, identify a valid order block before an impulse. A bearish order block is the last bullish candle before a strong push down. A bullish order block is the last bearish candle before a strong push up. The candle is the supposed institutional decision point. Mark the high and low of the candle as the order block zone.
Step 2, wait for price to break through the order block. A return tap is not enough. The criterion is a body closebeyond the order block boundary, on the trading timeframe. A wick that pierces and closes back inside is rejection — the order block held. Only a body close on the other side counts as failure.
Step 3, confirm a market structure shift. This is where ICT vocabulary tightens up. Either a Break of Structure (BOS) — a higher high or lower low confirming the new direction — or a Change of Character (CHoCH), also called Market Structure Shift (MSS), where price takes out the most recent intermediate swing in the new direction. Without that confirmation, you have a failed order block but no regime change yet, and the setup is incomplete.
Step 4, wait for the retrace. Price does not usually run from the break to a clean target. It pulls back, often into the now-failed order block from the other side. That retrace is the breaker block retest. It is the entry zone. Aggressive traders place a limit order in the zone. Patient traders wait for a lower-timeframe rejection candle (an engulfing, a strong wick, a CHoCH on the 5m or 15m) inside the zone before pulling the trigger.
Two more details that practitioner sources keep coming back to. The retest should ideally happen after a liquidity sweep(also called a liquidity grab), which is a wick that takes out an obvious swing high or low where retail stops were sitting, before the structure shift. A breaker block paired with a Fair Value Gap (FVG) inside the same zone is what some ICT educators call the Unicorn, and it is treated as a higher-probability variant. None of this is magic, but stacking these conditions reduces the number of false setups you will trade.
Bullish and bearish breaker block setups
Bullish and bearish breaker blocks are mirror images, but the details matter. Misplacing the stop loss by a few candles is the most common reason a textbook setup ends up at break-even or worse.
To trade breaker blocks reliably, you have to read both directions. A bullish breaker block forms from a failed bearishorder block. The chart reads like this: a downtrend builds with a bearish order block defending the lower highs; price runs the previous swing low (a liquidity sweep / stop hunt); on the bullish reversal, price closes back above the bearish order block; market structure shifts bullish when an intermediate swing high is taken out. The breaker block is the failed bearish order block, now flipped to support.
For this setup, the entry is a buy limit at the breaker block zone, or a confirmation entry on a 5-minute or 15-minute bullish CHoCH inside the zone. The stop loss belongs beyond the wick of the liquidity sweep low, not just below the breaker body, since stops parked there are routinely tagged. Take profit one is the nearest opposing liquidity pool or the last lower high, with a minimum 1:2 risk-to-reward. Take profit two is the opposing extreme of the higher timeframe range or the next imbalance.
A bearish breaker block is the inverse. Uptrend with a bullish order block. Liquidity sweep of the last swing high. A bearish candle close back below the bullish order block. Market structure shifts bearish on a swing low takeout. The failed bullish order block becomes resistance. Sell limit at the zone, or wait for a lower-timeframe bearish CHoCH inside it. Stop loss beyond the wick of the swept high. Targets are the next sell-side liquidity pool, then the higher timeframe range low.
The candle anatomy matters. The entry zone is the last consecutive cluster of opposite-colored candles before the swept extreme. For a bullish breaker, that means the last cluster of up-close candles before the bearish flush. For a bearish breaker, the last cluster of down-close candles before the bullish stop hunt. Drawing the box correctly is the difference between catching a clean retest and watching price slice through a misdrawn zone.
Breaker blocks vs order blocks vs mitigation blocks
These three concepts are routinely confused, and not by accident, because practitioners use them with slightly different definitions. Below is a clean working version of each.
| Concept | What it marks | Signal | Trade implication |
|---|---|---|---|
| Order block (OB) | Last opposing candle before an impulse that breaks structure | Trend continuation zone where institutions presumably opened | Buy at bullish OB in uptrends, sell at bearish OB in downtrends |
| Mitigation block | An OB that price re-tested and respected (partial fill scenario) | Trend still intact; institutional "mitigation" of unfilled orders | Trade in the direction of the original OB |
| Breaker block | An OB that price closed through, then revisited from the other side | Regime change: the OB has flipped polarity | Trade against the original OB direction |
The simplest mental rule is direction. An order block trades with the original move. A mitigation block trades with the original move on a respectful retest. A breaker block trades against the original move because the original move has failed. The third row is what makes breakers attractive — they catch reversals while still using the same basic vocabulary the rest of SMC uses for continuation.
Why breakers matter in the 2025-2026 crypto cycle
Breaker blocks are not a crypto-only idea, but the 2025-2026 market gave the concept a busy stage. Bitcoin's October 2025 ATH of $126,198 was followed by a cascade liquidation that took price near $84,000 in days. CoinGecko's 2026 Q1 industry report puts the total crypto market cap at $2.4 trillion at the end of March 2026, down 20.4% from the prior quarter and roughly 45% below the October 2025 peak. BTC quarterly performance was -22.0% in Q1 2026. Daily average crypto trading volume sat at $117.8 billion, down 27.2% quarter-on-quarter, and centralized exchange spot volume in March 2026 was the lowest since November 2023.
In a market like that, the failed-order-block pattern shows up everywhere, and market liquidity at major round numbers is where the most readable breakers form. The bullish order blocks defending the run from $76,600 in March 2025 to the October ATH eventually failed, and the broken zones acted as resistance for weeks afterward. SMC traders publishing on TradingView labelled these as bearish breakers. None of it is a guarantee, since liquidation cascades blow through any technical level instantly when funding rates and open interest are stretched, but the concept gives a working language for what the market did.
A few of the macro events practitioners have framed as breaker setups in hindsight:
| Asset | Date | Setup | Outcome |
|---|---|---|---|
| BTC/USD | March 2025 | Daily bullish breaker after capitulation low near $76,600; failed bearish OB flipped to support | Recovered toward $95,000 by late April |
| BTC/USD | Oct 6–10, 2025 | Bullish OB at the $126,198 ATH zone failed; broken zone formed bearish breaker on retest | Traded to ~$84,000 within days; resistance held into Q4 close at ~$87,000 |
| BTC/USD | Q1 2026 | Daily bearish breakers after Fed hawkish reprice; failed bullish OBs around $100–105K | -22.0% quarterly performance; sub-$80K print in March |
The retail audience for these ideas is not small. Investment Trends counted 186,000 active US retail margin forex traders in 2024-2025, with 71,000 new or reactivated. CoinLaw reports that retail accounts for around 6% of the daily $7.51 trillion FX turnover, while more than 90% of FX volume is now algorithmic. Smart money concepts and breaker blocks live mostly in the small remaining retail slice, but it is a slice with real volume behind it.

Tools and timeframes for trading breaker blocks
Trading with breaker blocks does not require special software. You can mark breaker blocks by hand on TradingView, ThinkOrSwim, MetaTrader 4 or 5, or any chart that lets you draw a rectangle. Several scripts automate the pattern. LuxAlgo publishes three free TradingView scripts under the "Order Blocks & Breaker Blocks" family, including a "Breaker Blocks with Signals" version that adds premium and discount levels for entry and stop placement. TradingFinder offers a "Unicorn ICT Signals" indicator that specifically marks the breaker-plus-FVG combo. AlgoAlpha ships a free "Breaker Blocks Signals" script. The free DropkingICT "ICT Breaker Blocks" script is a popular starting point. On MetaTrader, the TFlab community indicators on ForexFactory have a long history.
On timeframes, the practitioner consensus from FluxCharts, FXOpen, Inner Circle Trader Network and TradingFinder is to use a higher timeframe for narrative (daily and 4-hour for trend bias and breaker location), and a lower timeframe for execution, typically 15-minute or 1-hour. Trading 5-minute breakers on illiquid altcoins is a common reason these trading strategies fail. Higher timeframe breakers form less often, but they hold more reliably and survive intraday noise. The same logic applies to combining breaker blocks with confluence: a 4-hour bearish breaker that lines up with a daily fair value gap is a different proposition than a 15-minute breaker on a Sunday afternoon.
An honest critique of the breaker block strategy
Treating breaker blocks as a guaranteed edge is the fastest way to lose money in this method. AlgoStorm's evidence-based review of ICT/SMC concludes there is no verified evidence that ICT strategies outperform other forms of technical analysis. No peer-reviewed backtest of breaker-block win rates has been published. The criticism from quant desks is also fair: actual institutional flow runs through VWAP and TWAP execution algorithms, not retail-visible candle patterns, and the dramatic narrative of "smart money" hunting retail stops is a simplification.
The trader I keep coming back to is the one who admits that on hindsight charts, breakers look obvious; in real time, they are subjective, and two competent SMC traders will routinely mark different boxes on the same EUR/USD chart. Crypto adds liquidation cascades, weekend liquidity holes and headline gaps that override any technical level. The pattern is real, and breakers do catch some of the cleanest market reversals when stacked with confluence. It is also one tool among many ICT concepts, and trading decisions still come down to risk management, confluence and position sizing.


