Understanding RSI Divergence and Trend Reversal
A divergence occurs when the price of an asset and a momentum indicator like the Relative Strength Index (RSI) move in opposite directions. This divergence between price and RSI often highlights a potential trend reversal or pause in momentum. It’s a moment when price action and RSI signals disagree — showing a hidden shift in bullish or bearish sentiment.
In 2025, trading RSI divergence remains one of the most used technical analysis tools among traders. Reports from CoinGlass reveal that more than 63% of crypto traders on Binance and OKX rely on the RSI indicator or divergence signal when designing their trading strategy. Backtests on TradingView show that including RSI divergence filters increased profitability by an average of 12.4% between 2020 and 2025.
Expert Insights on RSI Divergence Indicator
Lena Petrova, senior market analyst, explains: “The RSI divergence indicator is one of the most reliable signals for spotting a trend reversal. When you use RSI in combination with volume and order flow, this indicator becomes a highly effective part of technical analysis.”
Marcus Hwang, portfolio manager at QuantEdge Capital, notes: “Our algorithms still rely heavily on RSI divergence signals for short-term reversals. The edge remains consistent, especially when validated by the moving average convergence divergence (MACD).”
Ethan Kim, independent quant analyst, offers a contrasting view: “RSI divergence can be powerful, but traders often overfit it. Without volume confirmation or macro context, it becomes noise.”
Ava Rodríguez, strategist at Bybit, cautions: “Retail traders often misunderstand divergence. Remember, a divergence signal only indicates weakening momentum, not a guaranteed reversal. Confirm it with candlestick patterns or trend structure before acting.”
What is the Relative Strength Index (RSI) and How to Calculate RSI
The Relative Strength Index (RSI) is a momentum indicator that measures the speed and magnitude of price movements over a fixed period, usually 14 candles. It produces an RSI value between 0 and 100, showing whether the market is overbought or oversold.
Here’s a simple example: Suppose a cryptocurrency gains $3 and loses $1 over 14 periods. The average gain is $3, average loss $1, and the RSI value would roughly calculate near 75 — indicating an overbought condition.
- RSI measures the balance between gains and losses.
- When gains dominate, RSI rises toward 100.
- When losses dominate, RSI drops toward 0.
If RSI is above 70, it suggests an overbought condition; below 30 signals oversold. Traders use RSI to identify bullish or bearish setups, often combining RSI and MACD for confirmation
Using RSI Divergence in Technical Analysis
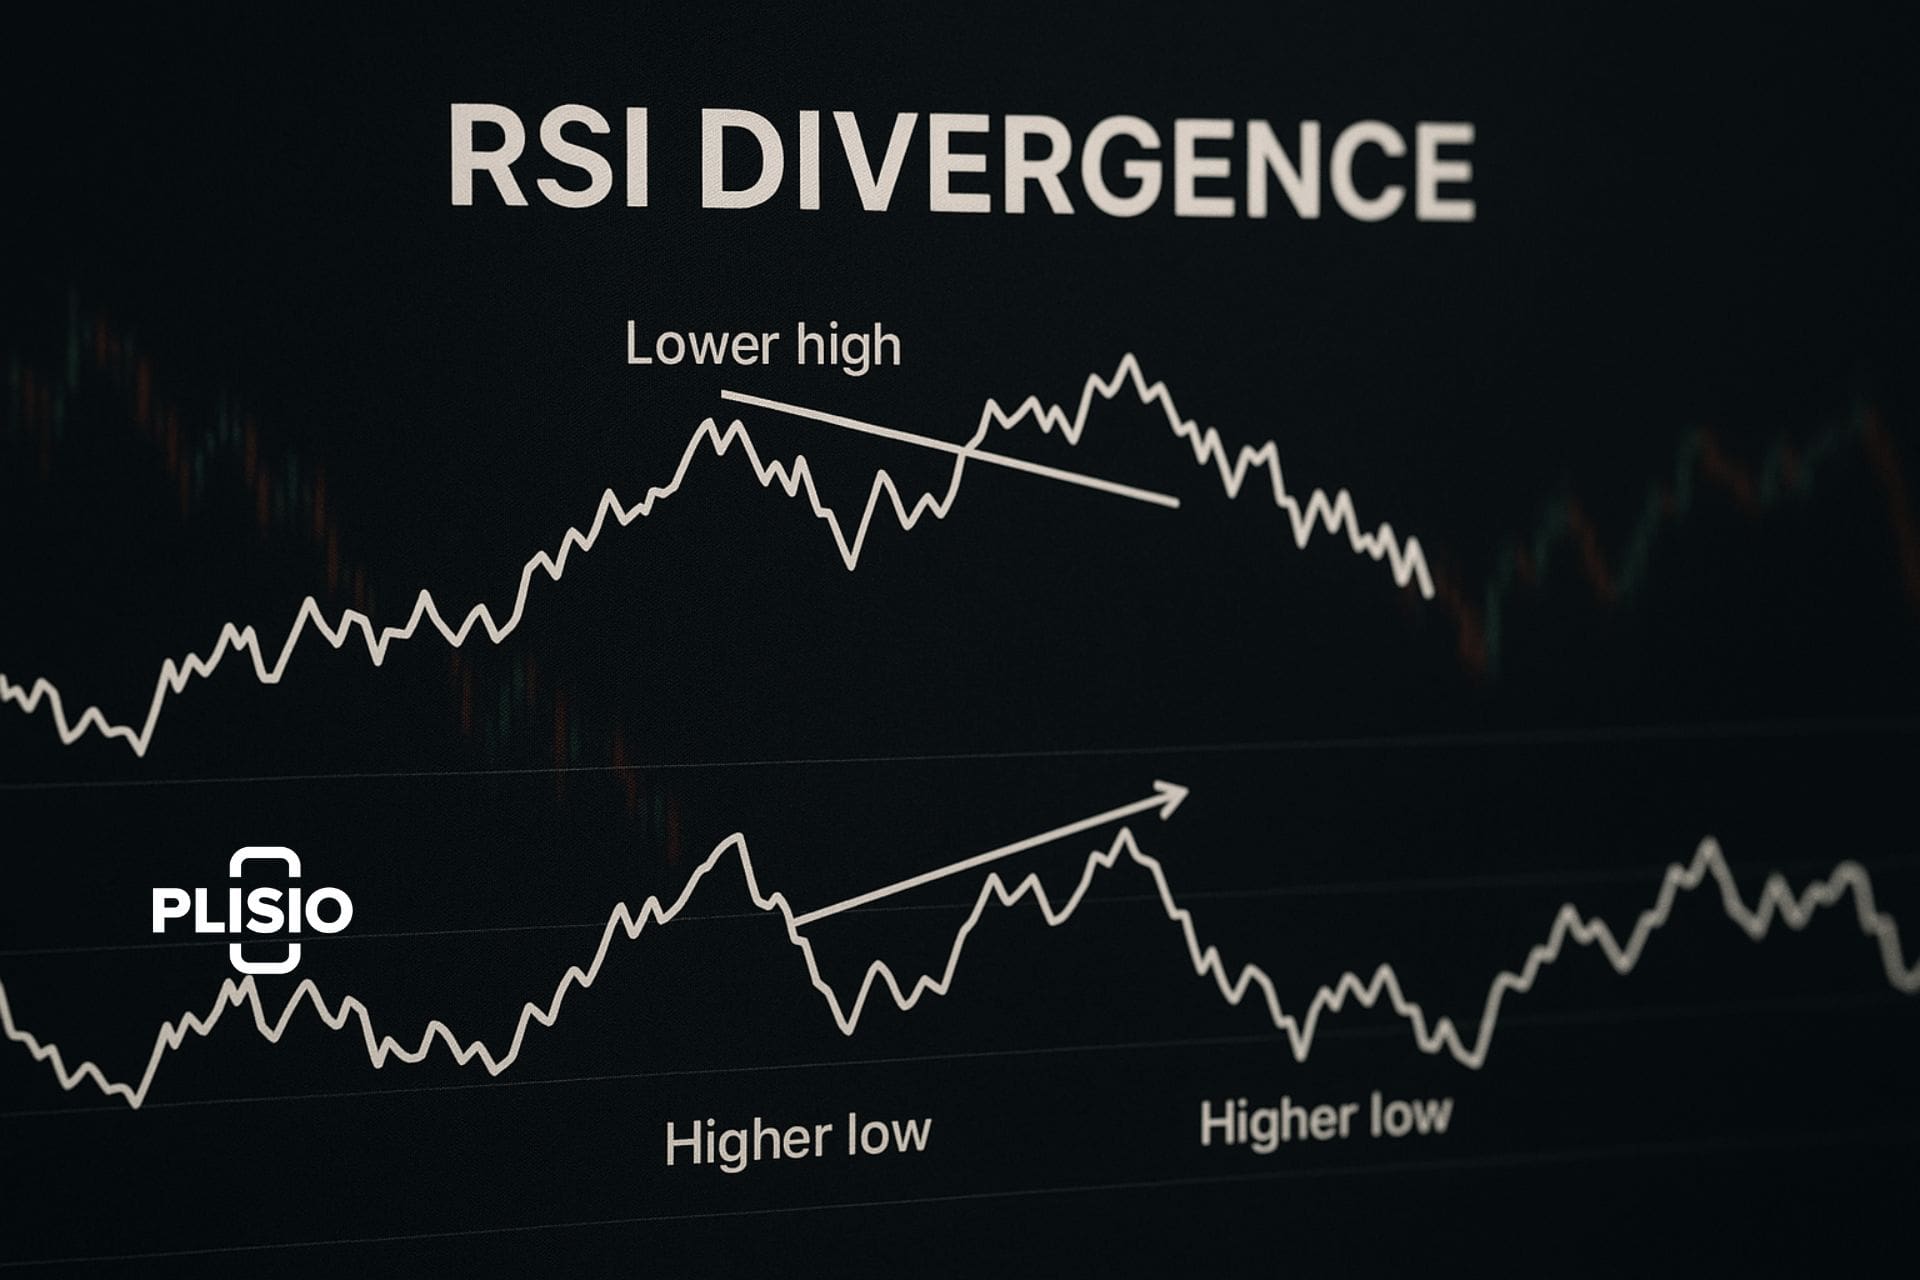
RSI divergence occurs when price makes a new high or low, but RSI fails to match that move:
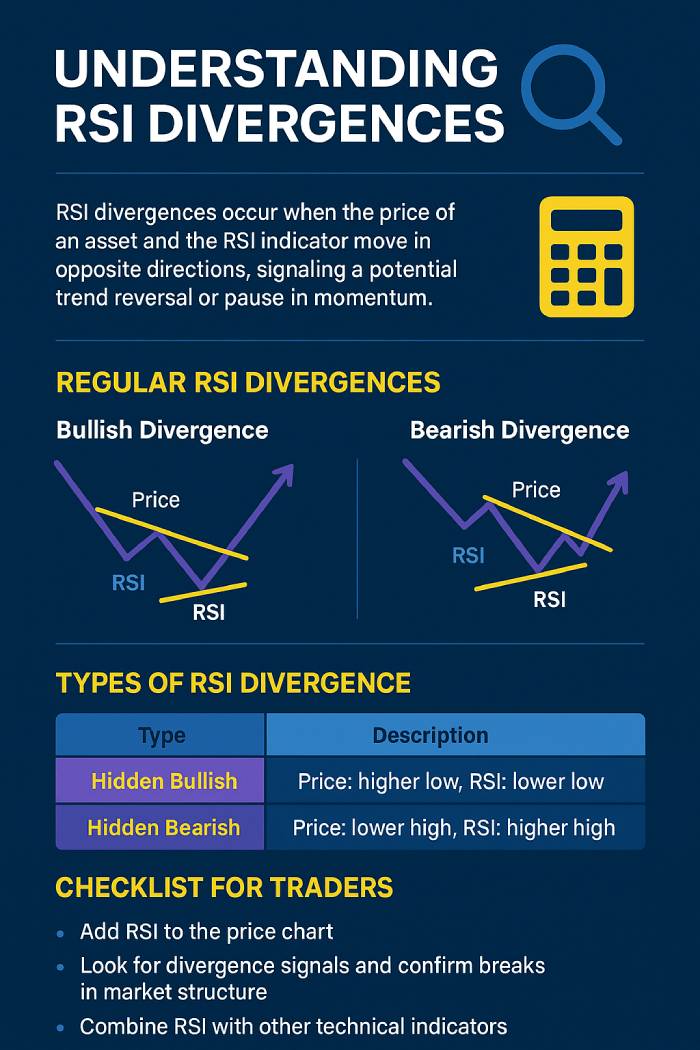
- Bullish RSI divergence: Price makes a lower low, but RSI makes a higher low, indicating potential bullish reversal and fading selling pressure.
- Bearish RSI divergence: Price makes a higher high, but RSI forms a lower high, suggesting bearish momentum and a possible pullback.
To visualize it, imagine a price chart where the candles climb to a new high, but the RSI line peaks lower — that’s bearish divergence in action.
According to a 2025 Binance Research report, RSI divergence signals on Bitcoin’s weekly chart resulted in confirmed reversals within 3–5 weeks in 58% of cases. Tom Lee, from Fundstrat, called the early 2025 bearish RSI divergence “a textbook indicator of weakening momentum before a market correction.”
Types of RSI Divergence and Trade Signals
| Type | Description | Implication |
|---|---|---|
| Regular Bullish Divergence | Price makes lower lows; RSI makes higher lows | Suggests weakening bearish momentum and possible bullish reversal |
| Regular Bearish Divergence | Price makes higher highs; RSI makes lower highs | Signals fading bullish momentum and possible correction |
| Hidden Bullish Divergence | Price forms higher low; RSI makes lower low | Indicates trend continuation upward |
| Hidden Bearish Divergence | Price forms lower high; RSI makes higher high | Indicates trend continuation downward |
As QuantifyLabs (2025) revealed, hidden divergence patterns accounted for 37% of profitable trades in algorithmic systems using the RSI divergence indicator, proving their ongoing relevance.
How Traders Identify RSI Divergence and Candlestick Patterns
-
Add the RSI indicator (14-period) to your price chart.
-
Compare price and RSI highs and lows.
-
Draw trendlines — if the slopes differ, a divergence occurs.
-
Confirm divergence using candlestick patterns, market structure, or volume.
Pro Tip: Avoid drawing lines across minor fluctuations; use major swing highs and lows for accuracy. Confirm with candlestick patterns like engulfing candles or hammers.
Victor Choi, senior trader at Nansen Alpha Desk, emphasizes: “Always combine RSI divergence with a clear candlestick pattern or RSI to confirm. Divergence alone rarely provides a high-confidence entry.”
When the RSI Divergence Indicator Works Best
The RSI divergence indicator performs best on higher timeframes (daily and weekly), especially after long trends where momentum begins to weaken. During a strong trend, divergence between price and RSI can persist, giving premature signals.
Beyond crypto, RSI divergence is also widely applied in equities and forex. Studies from ForexFactory show that daily RSI divergence signals preceded reversals in 62% of tested stock pairs between 2022 and 2025.
As of Q4 2025, Bitcoin is up 42% YTD, while Ethereum’s RSI divergence correctly identified five out of seven local reversals. Data from CoinMetrics shows these RSI-based trading strategies achieved a Sharpe ratio of 1.28, surpassing moving average-only systems.
Common RSI Divergence Mistakes
- A divergence indicator doesn’t ensure a reversal.
- Bearish RSI divergence may fail if price makes a higher high but the RSI follows.
- On lower timeframes, divergence suggests only short-lived retracements.
RSI Divergence vs Other Indicators
A 2025 CFA Institute survey found that 71% of professional traders use RSI divergence as a primary or secondary indicator for confirmation. Experts note that RSI measures shifts in momentum, but combining it with RSI and MACD, stochastic oscillators, or volume provides stronger trade signals.
Conclusion: Using RSI Divergence for Trading Strategy
Before entering a trade using RSI divergence, follow this quick checklist:
- Confirm divergence on higher timeframes.
- Validate with candlestick patterns or structure.
- Check volume and volatility for confluence.
- Manage risk with stop-loss orders and position sizing.
The RSI divergence indicator remains a core component of modern technical analysis. It helps traders identify trend reversals or continuations by showing when price and RSI move in opposite directions.
As Ava Rodríguez concludes: “Using RSI divergence effectively means understanding when momentum and price disagree — that’s the moment the best opportunities reveal themselves.”


