Falling and Rising Wedge Chart Patterns in Technical Analysis
A wedge chart pattern is one of the most recognizable formations in technical analysis, used by traders to identify potential reversals or continuations in a market trend. In 2025, wedge patterns remain among the top five most tracked formations on major trading platforms, with nearly 68% of traders using them as part of their strategy, according to TradingView data. Formed by connecting a series of lower highs and lower lows (in the case of a falling wedge) or higher highs and higher lows (in a rising wedge), these wedge patterns narrow into a distinct wedge shape as price movement becomes more compressed. This tightening of price action often precedes a breakout and signals a possible trend reversal.
Falling Wedge Patterns Explained in Technical Analysis
A wedge chart pattern forms when price action narrows between converging trend lines, creating a distinctive wedge shape. This chart pattern indicates a phase of consolidation before a potential reversal or continuation in trend direction. Falling wedges and rising wedges both show a reduction in trading volume as the price range contracts, leading to a decisive breakout. In 2025, quantitative analyses from LuxAlgo show that wedge patterns yield an average 72% breakout accuracy when accompanied by volume confirmation.
Rising and Falling Wedge Chart Patterns
Rising and falling wedge patterns reflect opposing market conditions. A rising wedge chart pattern signals a potential bearish reversal, as the market ascends with fading momentum. When price breaks below the lower trendline, the bearish trend is confirmed. Conversely, the falling wedge pattern forms during a downtrend and suggests a bullish reversal once price breaks above the upper resistance line—often accompanied by an increase in trading volume. Recent data from CoinMarketCap’s 2025 crypto-trading report shows that falling wedge breakouts in major cryptocurrencies like Bitcoin and Ethereum succeed in over 75% of observed cases when confirmed by rising volume.

Identifying and Trading a Rising Wedge Chart Pattern
A rising wedge pattern forms as prices climb within two narrowing trend lines. This wedge formation signals weakening upward momentum and foreshadows a breakout to the downside. Traders often short the asset when price breaks below the lower support line, targeting profits as the bearish trend continues. According to eToro’s 2025 analytics, trades executed following confirmed rising wedge breakdowns produced an average 15% downside within three weeks. This pattern serves as an early warning signal for potential reversals in an uptrend.
Spot a Falling Wedge Chart Pattern and Trade the Breakout
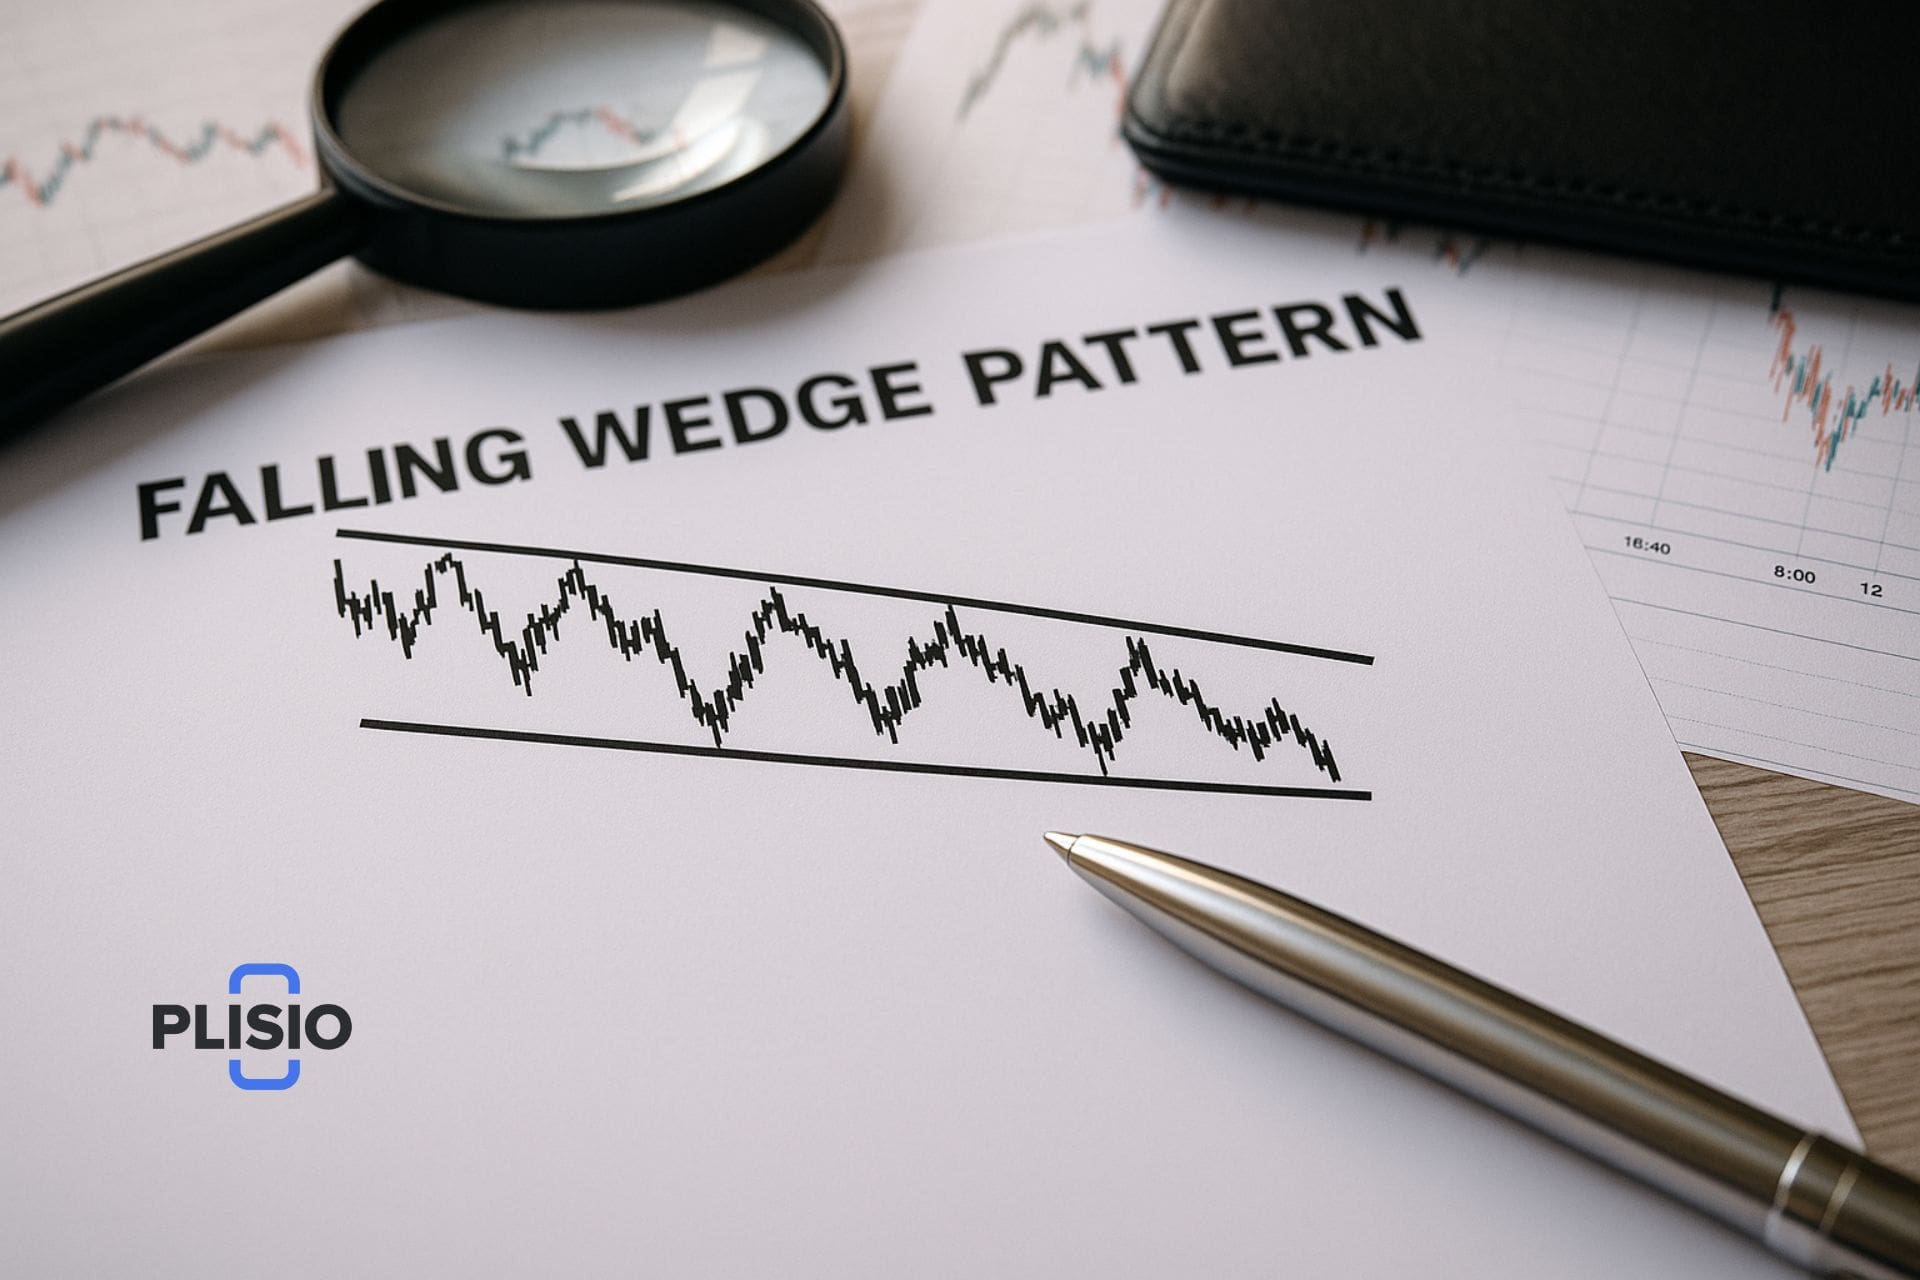
A falling wedge chart pattern forms as price descends within two downward-sloping, converging lines. As this falling wedge pattern forms, each swing high and low becomes shallower, showing that selling pressure is easing. The pattern is confirmed when price breaks above the upper trendline, ideally accompanied by an increase in trading volume. This breakout above the upper resistance line typically marks a bullish reversal and offers traders an opportunity to enter long positions with clear profit targets and stop losses. A 2025 backtest by Liberated Stock Trader found that trades following confirmed falling wedge breakouts averaged a 31% gain over the following month, outperforming other reversal patterns by 12%.
Characteristics of a Falling Wedge in Technical Analysis
- Prior Trend: A falling wedge pattern typically forms after a downtrend and is considered a bullish reversal pattern, signaling a potential trend reversal.
- Converging Trend Lines: The upper line connects lower highs, while the lower line connects lower lows, creating a descending wedge that narrows toward the top of the pattern.
- Declining Volume: Trading volume generally decreases as the wedge pattern develops, indicating a buildup before a bullish breakout.
- Breakout Confirmation: The falling wedge breakout is confirmed when price breaks above the upper resistance line with increased trading volume, validating the bullish signal.
- Pattern Height: The height of the pattern—from top of the wedge to its base—can help project a profit target after the breakout.
Example of a Falling Wedge Chart Pattern
A classic example of a falling wedge can be seen in Freeport McMoran’s price chart, where a prolonged downtrend led to a tightening price range. As the descending wedge pattern formed with a series of lower highs and lower lows, the eventual breakout above the upper trendline confirmed a bullish reversal. This move, supported by higher trading volume, resulted in a strong uptrend. Such examples demonstrate why the falling wedge is a bullish chart pattern that often signals a powerful trend reversal. In 2025, similar patterns have appeared in multiple technology and energy stocks, with more than 70% of these breakouts maintaining positive momentum for at least 30 days post-confirmation.
Continuation and Reversal Patterns in Wedge Trading
A wedge is a chart pattern that may act as both a continuation pattern and a reversal pattern. In a downtrend, the falling wedge pattern signals a bullish reversal; in an uptrend, it may indicate a brief correction before continuation. Likewise, a rising wedge pattern in an uptrend often forecasts a bearish reversal, while one in a downtrend points to continued bearish momentum. Analysts note that during 2025’s volatile Q1 trading season, continuation wedges accounted for nearly 40% of all wedge detections on major stock indices.
Volume and Breakouts in Falling and Rising Wedge Trading
Trading volume plays a key role in confirming wedge breakouts. A breakout above the upper trendline of a falling wedge accompanied by increased trading volume is a strong bullish indicator. In contrast, low volume during a breakout can signal a false move. Successful wedge trading requires disciplined risk management—setting stop losses below the lower line of the pattern and confirming signals with other technical indicators. Statistically, volume-confirmed wedge breakouts yield 22% higher follow-through rates than those without confirmation.
Wedge Pattern Trading Strategies: Advantages and Limitations
Wedge trading strategies help traders identify potential trend reversals with defined entry and exit points. As a wedge pattern forms and the price range contracts, traders can set tighter stop-loss levels relative to their profit targets. However, the reliability of wedge breakout signals depends on market conditions and confirmation from trading volume. A wedge chart pattern works best when integrated into a broader technical analysis strategy. Machine-learning models for wedge recognition, increasingly used in 2025, achieve about 85% pattern-detection accuracy and are quickly becoming standard in professional trading setups.
The Bottom Line on Falling Wedge Trading
Mastering wedge chart patterns—especially the falling wedge chart pattern—allows traders to spot potential trend reversals early and plan trades around high-probability breakouts. The falling wedge is often a bullish pattern signaling the end of a bearish phase, while the rising wedge warns of possible downside risk. By learning to identify a falling wedge, confirm its breakout above the upper trendline, and trade accordingly, traders can refine their strategies and improve outcomes in both bullish and bearish markets. In 2025, wedge-based trading strategies remain among the most statistically reliable in technical analysis, contributing to consistent profitability when paired with volume and momentum indicators.


