What Is Year-over-Year (YOY) And How To Use It?

Year-over-Year (YOY), also known as year-on-year, is an essential metric in financial analysis, employed to compare data from the current year against the previous one. This analytical method is pivotal for understanding the changes in key financial metrics such as revenues, expenses, and profits over annualized periods. By evaluating these changes, finance professionals can discern growth trends, identify patterns, and make informed strategic decisions.
The YOY comparison is particularly valuable because it allows analysts and investors to assess whether a company's financial performance is improving, remaining static, or deteriorating over time. For instance, a business may report that its revenues have increased in the third quarter on a YOY basis for the last three years, signaling consistent growth. Such insights are crucial for stakeholders to gauge the health and trajectory of a business.
Furthermore, YOY analysis is not limited to company financials alone; it extends to broader economic contexts as well. Economists often use this approach to analyze macroeconomic indicators across different countries. For example, a YOY assessment might reveal that Japan's GDP grew by 2% in 2016 compared to 2015, a figure slightly higher than the 1.8% growth previously projected by analysts. This type of analysis is instrumental in understanding economic conditions, forecasting future trends, and setting policy directions.
The utility of YOY analysis also lies in its ability to provide a clear, standardized measure of comparison, free from the fluctuations and variances that shorter-term comparisons might exhibit. This makes it an indispensable tool in the arsenal of financial professionals aiming to provide a thorough and nuanced view of financial or economic health, both on a corporate and a national level. By consistently using YOY comparisons, stakeholders can maintain a strategic overview of performance while navigating the complexities of financial markets and economic environments.
What Is Year-over-Year (YOY) And How To Use It?
Common Financial Metrics for YOY Analysis
The YOY comparison of specific financial metrics provides a clear view of an organization's fiscal health and operational success:
- Sales Revenue: This metric assesses the increase or decrease in sales over the year, offering insights into market demand and business growth.
- Cost of Goods Sold (COGS): Analyzing COGS year over year helps evaluate how effectively a company manages its production costs and gross margins.
- Selling, General & Administrative Expenses (SG&A): This reflects how well corporate office expenses are managed year over year, crucial for understanding operational efficiency.
- Earnings Before Interest, Taxes, Depreciation, and Amortization (EBITDA): Serving as a proxy for operating profit and cash flow, EBITDA highlights the profitability before financial and accounting deductions.
- Net Income: Comparing net income annually reveals the bottom line growth or contraction, indicating overall profitability.
- Earnings Per Share (EPS): EPS measures the profitability on a per-share basis, useful for investors assessing value generation.
Common Economic Indicators for YOY Analysis
Economic analysts use YOY comparisons to understand macroeconomic trends:
- Inflation: Tracking inflation YOY reveals price stability or volatility in an economy, influencing monetary policy decisions.
- Unemployment Rates: This metric shows workforce participation trends, reflecting the overall employment health.
- Gross Domestic Product (GDP): YOY GDP growth rates provide insight into the economic activity and productivity of a country.
- Interest Rates: Observing the trends in interest rates helps determine the financial climate, affecting everything from consumer borrowing to investment returns.
Common Uses of YOY Analysis
YOY analysis is employed across various fields for strategic decision-making:
- Revenue and Profit: Businesses track these metrics to understand growth, profitability, and trends over the years, adjusting strategies accordingly.
- Inflation and KPIs: Economists and business leaders monitor inflation and Key Performance Indicators like user numbers, delivery speeds, and sales volumes to align their operational or policy measures.
Relevance and Importance
Today, with fluctuating market conditions and economic uncertainties, YOY analysis is more crucial than ever. It helps stakeholders identify trends, anticipate changes, and make informed decisions. For example, during the economic impacts of global events like the COVID-19 pandemic, YOY analysis was essential in tracking the rapid changes in consumer behavior, supply chain disruptions, and government policy impacts on industries.
By utilizing YOY analysis, both business leaders and economic analysts can maintain a strategic overview, ensuring that their decisions are data-driven and aligned with both short-term responsiveness and long-term strategic goals.
Step-by-Step YOY Calculation
The process of calculating YOY growth is straightforward but requires careful attention to detail to ensure accuracy:
- Identify the Comparable Metrics: Select the data points for comparison. For example, units sold, revenue, or profit from one year to the next.
- Calculate the Percentage Change: Take the value from the current year and divide it by the value from the previous year. Then, subtract one from the result to find the percentage change.
Example in Unit Sales
Consider a scenario where a company sold 506 units in Q3 2018 and 327 units in Q3 2017. The YOY growth calculation would be:
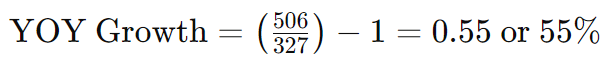
This indicates a 55% increase in units sold on a year-over-year basis from Q3 2017 to Q3 2018.
Applying YOY Analysis Using Microsoft Excel
Excel can be an invaluable tool for performing YOY analysis efficiently. Here’s how you can apply it:
Example of Revenue Analysis
If a company's revenues for 2022 were $33,087 and increased to $38,050 in 2023, the YOY revenue increase can be calculated as follows:
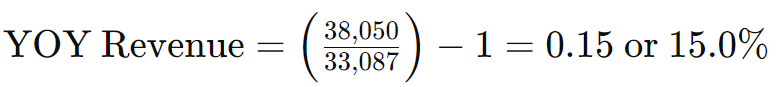
This analysis reveals a 15.0% increase in revenue, which can help management make informed decisions about budget allocations, potential for expansion, and resource management.
Understanding Profit Changes
Similarly, if the profit growth is significantly higher than revenue growth, it suggests efficiency improvements or potentially lower costs. For example, a 46.3% increase in profit alongside a 15.0% increase in revenue would suggest notable operational improvements or cost efficiencies.
Importance of YOY Analysis in Business Decision Making
By using YOY analysis, businesses can track their performance trends over time, identify growth patterns, and diagnose potential issues before they become systemic. This analysis is crucial not just for internal assessments but also for presenting to stakeholders, investors, and external audiences who are interested in the company’s progress.
YOY analysis serves as a fundamental metric in financial modeling and forecasting, helping businesses navigate through fluctuating market conditions and aligning their strategies with long-term goals. Understanding these dynamics through practical examples and calculations enables businesses to harness data-driven insights for robust decision making.
Alternatives to YOY Analysis
While YOY provides an annualized comparison, there are other intervals that can offer additional insights:
- Month-over-Month (MoM): This measures the change from one month to the next, providing frequent data points and helping to identify short-term trends or seasonal effects. It's especially useful in internal financial reports where immediate adjustments may be necessary.
- Quarter-over-Quarter (QoQ): Similar to YOY but on a quarterly basis, this metric compares data from one quarter to the previous quarter. It's commonly used in quarterly financial reports as required by regulatory bodies like the Securities and Exchange Commission (SEC) for publicly traded companies. This timeframe is particularly useful for spotting trends that may not be as apparent on a monthly basis.
- Week-over-Week (WoW): Although less common in mature businesses due to its short timeframe, WoW analysis is valuable for startups and high-growth companies. This metric can capture rapid changes in user growth, revenue, and margins, offering real-time feedback on business operations.
- Year-to-Date (YTD): YTD analysis tracks changes from the beginning of the calendar year up to the current date. Unlike YOY, which compares 12-month periods, YTD provides insight into performance from January 1st to the present, making it ideal for assessing progress towards annual goals.
Compound Growth Rates
Another important metric is the compound growth rate, which provides a smoothed average rate of growth over multiple time periods. This can be particularly informative when analyzing data that experiences volatility or significant fluctuations, as it gives a clearer picture of long-term trends.
Practical Applications in Financial Analysis
These metrics are not just academic; they have real-world applications in financial analysis, portfolio management, and strategic planning. For instance, understanding the nuances of these metrics can enhance financial modeling, valuation, and even investment decisions.
By diversifying the metrics used, analysts can gain a more comprehensive view of a company's performance, better predict future trends, and make more informed decisions. Whether it’s YOY, QoQ, MoM, WoW, or YTD, each metric serves a specific purpose and offers unique insights, contributing to a well-rounded financial analysis.
Limitations of Year-over-Year (YoY) Analysis
Year-over-Year (YoY) analysis is widely used for assessing financial performance across various industries. However, this metric does come with certain limitations that can impact its effectiveness in some scenarios. Unlike Month-over-Month (MoM) analysis, YoY provides fewer data points within a given period, potentially overlooking shorter-term trends that are crucial for informed decision-making.
A notable drawback of YoY analysis is its inability to account for seasonality. Seasonality refers to how specific times of the year affect business operations and revenues, a factor particularly critical in industries like tourism and hospitality. For instance, ski resorts, beach hotels, and seasonal eateries often experience significant fluctuations in business activity based on the time of year. YoY analysis might not accurately reflect these seasonal impacts, as it compares one year to the corresponding period in the previous year, potentially missing out on the nuances of seasonal peaks and troughs.
This oversight can lead to missed opportunities for operational adjustments that could save costs or enhance revenue. For businesses highly affected by seasonality, understanding these patterns is essential for strategic planning. These companies could benefit from supplementing YoY data with more frequent analyses, such as MoM or even Week-over-Week (WoW), to make more timely adjustments. For example, knowing the detailed seasonal trends could enable a resort to optimize staffing, marketing, and operational expenditures to better align with expected seasonal demand.
Additionally, integrating advanced analytics and forecasting models that specifically include seasonal adjustments can provide a more accurate picture of financial health and help guide more effective strategic decisions. By acknowledging and compensating for the limitations of YoY analysis, businesses can ensure a more comprehensive approach to financial reporting and strategy formulation.
Conclusion
Year-over-Year (YOY) analysis stands as a critical tool in financial and economic spheres, providing a standardized way to assess and compare performance metrics across annual periods. By leveraging YOY comparisons, financial professionals, business leaders, and economists can gain essential insights into the dynamics of revenue, profit, expenses, and other economic indicators. These insights facilitate informed strategic decisions, helping stakeholders understand whether a company or economy is progressing, stagnating, or regressing.
Despite its widespread utility, it's crucial to recognize that YOY analysis is not without limitations. It can obscure short-term fluctuations and seasonal impacts, which are vital in industries like tourism and retail. Therefore, complementing YOY with other metrics such as Month-over-Month (MoM), Quarter-over-Quarter (QoQ), and Year-to-Date (YTD) analyses can provide a more granular view of trends and operational cycles. Additionally, for rapidly changing environments like startups or digital markets, more frequent metrics like Week-over-Week (WoW) can offer immediate feedback and deeper insights.
As markets continue to evolve and new complexities emerge, the importance of YOY analysis remains undiminished. It offers a reliable framework for long-term assessment and is integral to financial forecasting and planning. However, its effective use requires an understanding of its scope and limitations. By strategically integrating YOY with other analytical tools, businesses and economists can ensure a comprehensive approach to financial analysis, enhancing their capability to navigate the unpredictable waters of global markets and economic change. This balanced approach enables proactive decision-making and strategic agility, key components to thriving in today's competitive and ever-changing landscape
