Best Indicators for Crypto Trading and Analysis in 2026
Picking the right indicator can make a huge difference in how well a trader can read the crypto market. Volatility is good for the digital economy, and being able to use technical indicators to understand it is what makes a trading strategy work. This article will look at the best indicators for trading cryptocurrencies, how they work, and how traders use them to make smart choices.
Moving Averages: The Cornerstone of Technical Analysis
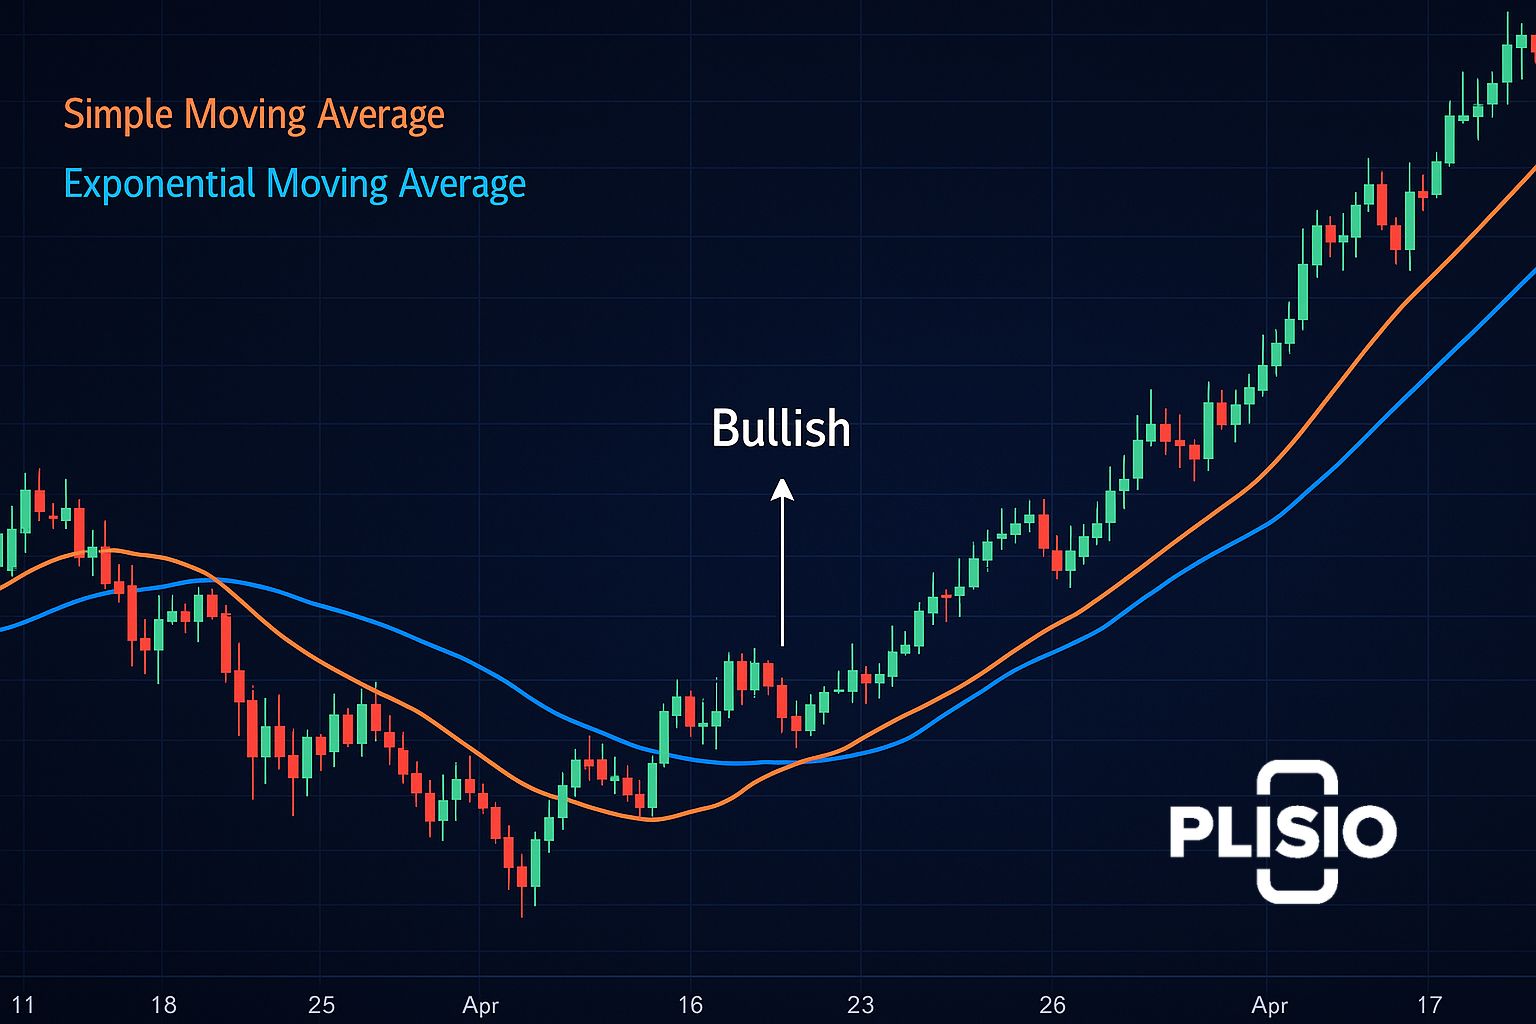
The moving average (MA) is still one of the most useful technical tools for trading cryptocurrencies. It figures out the average price of a cryptocurrency over a set period of time, which makes sense of the confusing market data. The simple moving average (SMA) and the exponential moving average (EMA) are two types of moving averages. The SMA treats all prices the same, but the EMA reacts more quickly to new data, which helps crypto traders see how prices have changed recently.
When used with MAs, indicators like RSI and MACD work well because they help traders figure out which way the trend is going and find possible entry and exit signals. When short-term averages cross long-term averages, it could mean that the market is going up or down.
An example of a trading insight is
- Traders can use the short-term EMA crossing above the long-term EMA as a sign that the market is going up and they should go long.
The indicator is based on the idea that prices move in a certain way. During a bear market, the MAs usually slope down, which means that sellers are in charge.
RSI (Relative Strength Index): Measuring Momentum and Emotion
The relative strength index, or RSI, is a momentum indicator that tells you if a crypto asset is too expensive or too cheap. When RSI values go above 70, it could mean that bullish sentiment is too high. When they go below 30, it could mean that bearish sentiment is about to turn around.
Many people use crypto indicators like RSI to look at trends and the market. When used with support and resistance levels, this analysis tool is very useful. There are a lot of technical indicators that give signals, but the RSI adds an emotional layer that shows where crypto investors might go too far.
Indicators work best when they work together. For example, the RSI and a trend line together can show divergence, which is when the price of an asset goes one way but the momentum goes the other. This is often a sign that something is wrong.
Some useful ways to use RSI are:
- Finding situations where something is overbought or oversold.
- Finding differences between price movement and momentum.
- Confirming signals from other technical indicators.
MACD (Moving Average Convergence Divergence): A Dual Indicator for Trend and Momentum
The MACD, which stands for moving average convergence divergence, shows both the direction and the strength of a market trend. The MACD line and the signal line are the two lines that make it up. When the MACD line goes above, it means that the market is going up; when it goes below, it means that the market is going down.
This indicator combines the ideas behind average convergence divergence and momentum indicators to give you the best of both worlds. There are a lot of technical indicators that can show the direction of a trend, but the MACD is special because it can show when the price of a cryptocurrency is converging or diverging.
Traders often look at the MACD histogram to see how strong the momentum is. If the bars get smaller, it could mean that the current market trend is losing strength. People often use the MACD with Bollinger Bands and volume analysis to get stronger trading signals.
|
Indicator |
Type |
Best For |
Common Signal |
|
RSI |
Momentum |
Detecting overbought/oversold |
Divergence |
|
MACD |
Trend & Momentum |
Following trend shifts |
Line crossovers |
|
Bollinger Bands |
Volatility |
Measuring price range |
Band expansion/contraction |
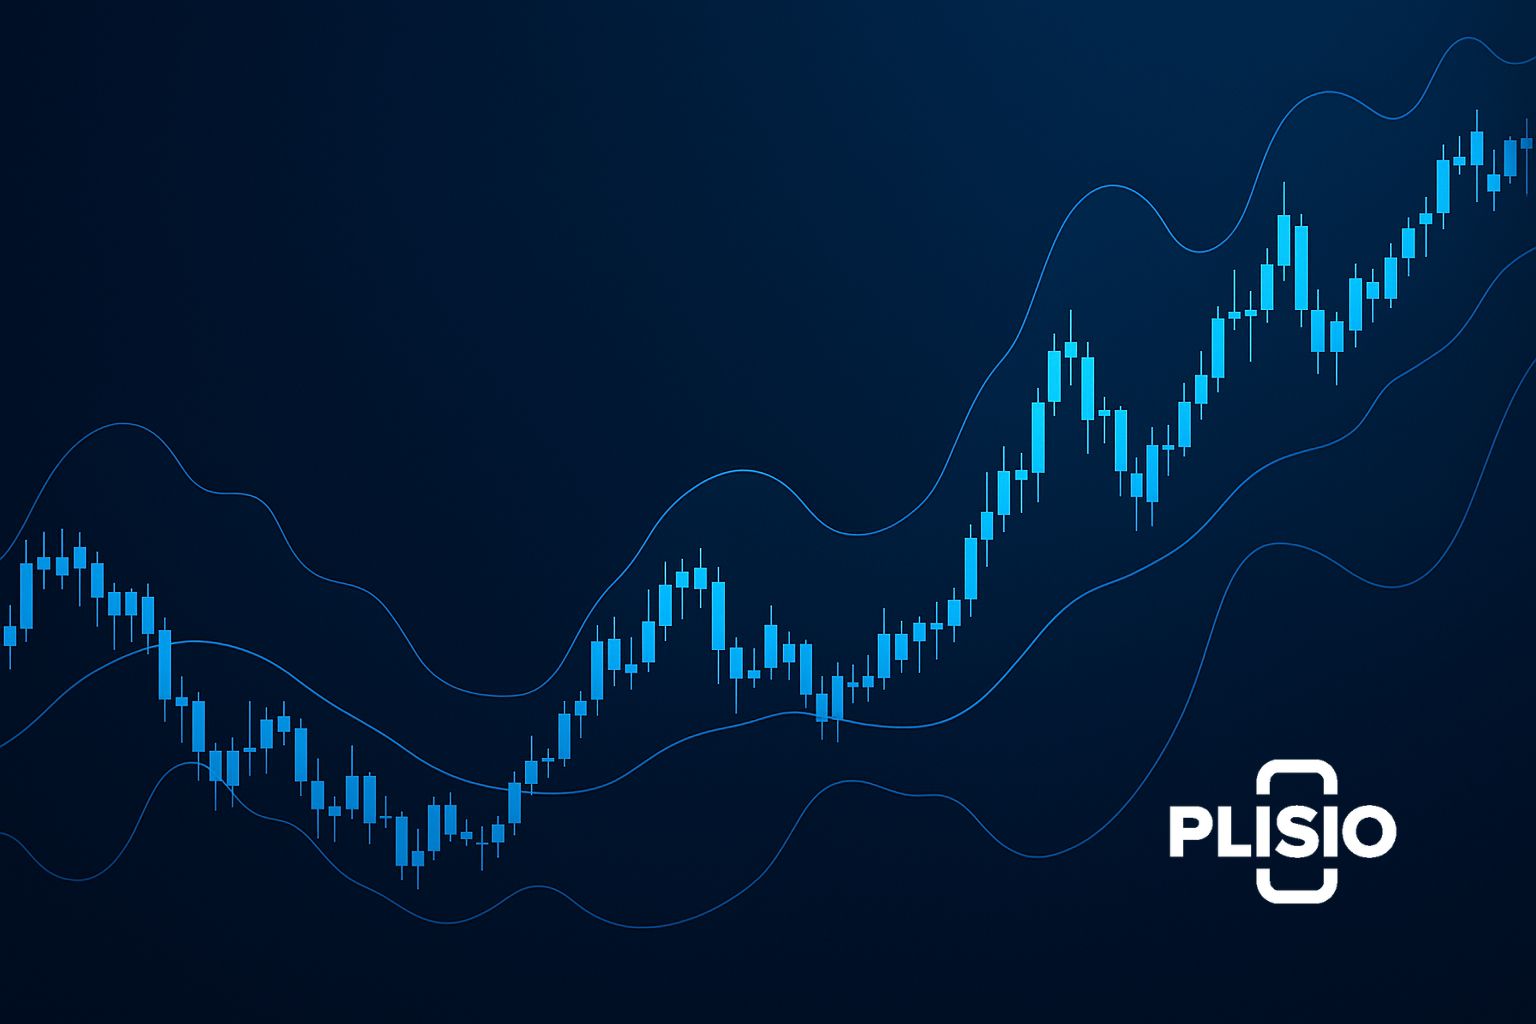
Bollinger Bands: Understanding Volatility
To understand how volatile the cryptocurrency market is, you need to know about Bollinger Bands. There are three lines: a middle moving average, and upper and lower bands that change size based on the market capitalization and trading volume.
When the price of a cryptocurrency gets close to the upper and lower bands, it means that it has gone too far. When the market is volatile, the space between the bands gets bigger. A narrow band means that the market is consolidating, while a wide band means that a breakout is coming. Traders can use crypto indicators like Bollinger Bands to guess how prices will move in the future.
If you use Bollinger Bands, here's a quick tip:
- Use them with support and resistance levels to make sure reversals are real.
- Combine them with the MACD line to check trade signals.
- Combine with RSI for exact timing.
Combining Multiple Indicators: Building a Trading System
To trade well, you need to be able to use more than one indicator. There is no one perfect indicator; instead, you need to use a lot of them together to confirm signals. This method cuts down on false alarms and makes things more consistent.
TradingView and other platforms have a lot of charting tools that show crypto indicators in real time. These charts help traders improve their trading systems by making sure that crypto technical setups match their own goals.
To use indicators correctly, crypto traders should always:
- Check signals from a number of technical indicators.
- Make sure that their fit with your trading strategy matches what the trend analysis says.
- Change your expectations based on the trend's direction and the market's trend.
RSI, MACD, Bollinger Bands, and moving average are some of the best crypto trading indicators. They can help investors and people in the crypto community make better trading decisions by giving them data-driven insights.
Final Thoughts: Using Indicators to Help Traders Succeed
The best indicators for trading cryptocurrencies aren't set in stone; they're flexible technical tools that can help you make sense of the crypto market. They help traders figure out the price of an asset, guess where it will go, and use trading insights to stay ahead of big changes in the crypto market. Traders can trade cryptocurrencies well by combining indicators to help them guess what will happen in the market.
Indicators each have their own pros and cons, and which ones you use depends on your own preferences and how you like to trade. Smart crypto traders know that the key is to find a balance. They use a combination of indicators, such as MAs, RSI, MACD, and Bollinger Bands, to read both trend and emotion.
The end result is a trading system that is stronger, smarter, and more flexible. It combines the best of both worlds—logic and intuition—in the cryptocurrency world, which is always changing.