Near Protocol (NEAR) Price Prediction 2026-2040
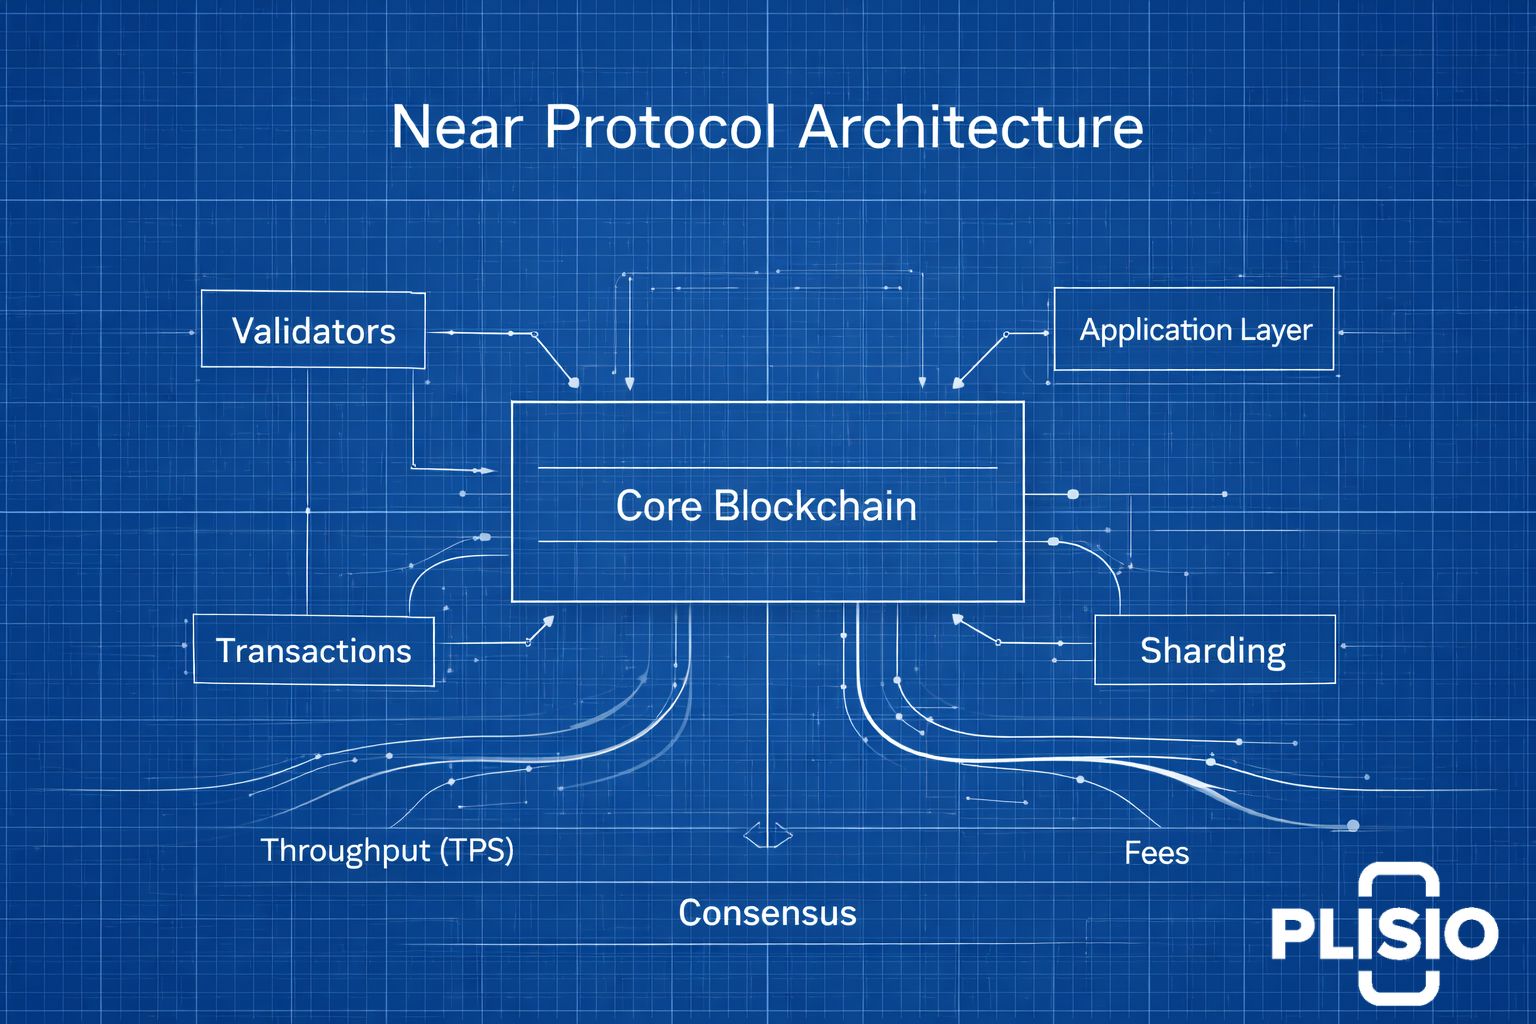
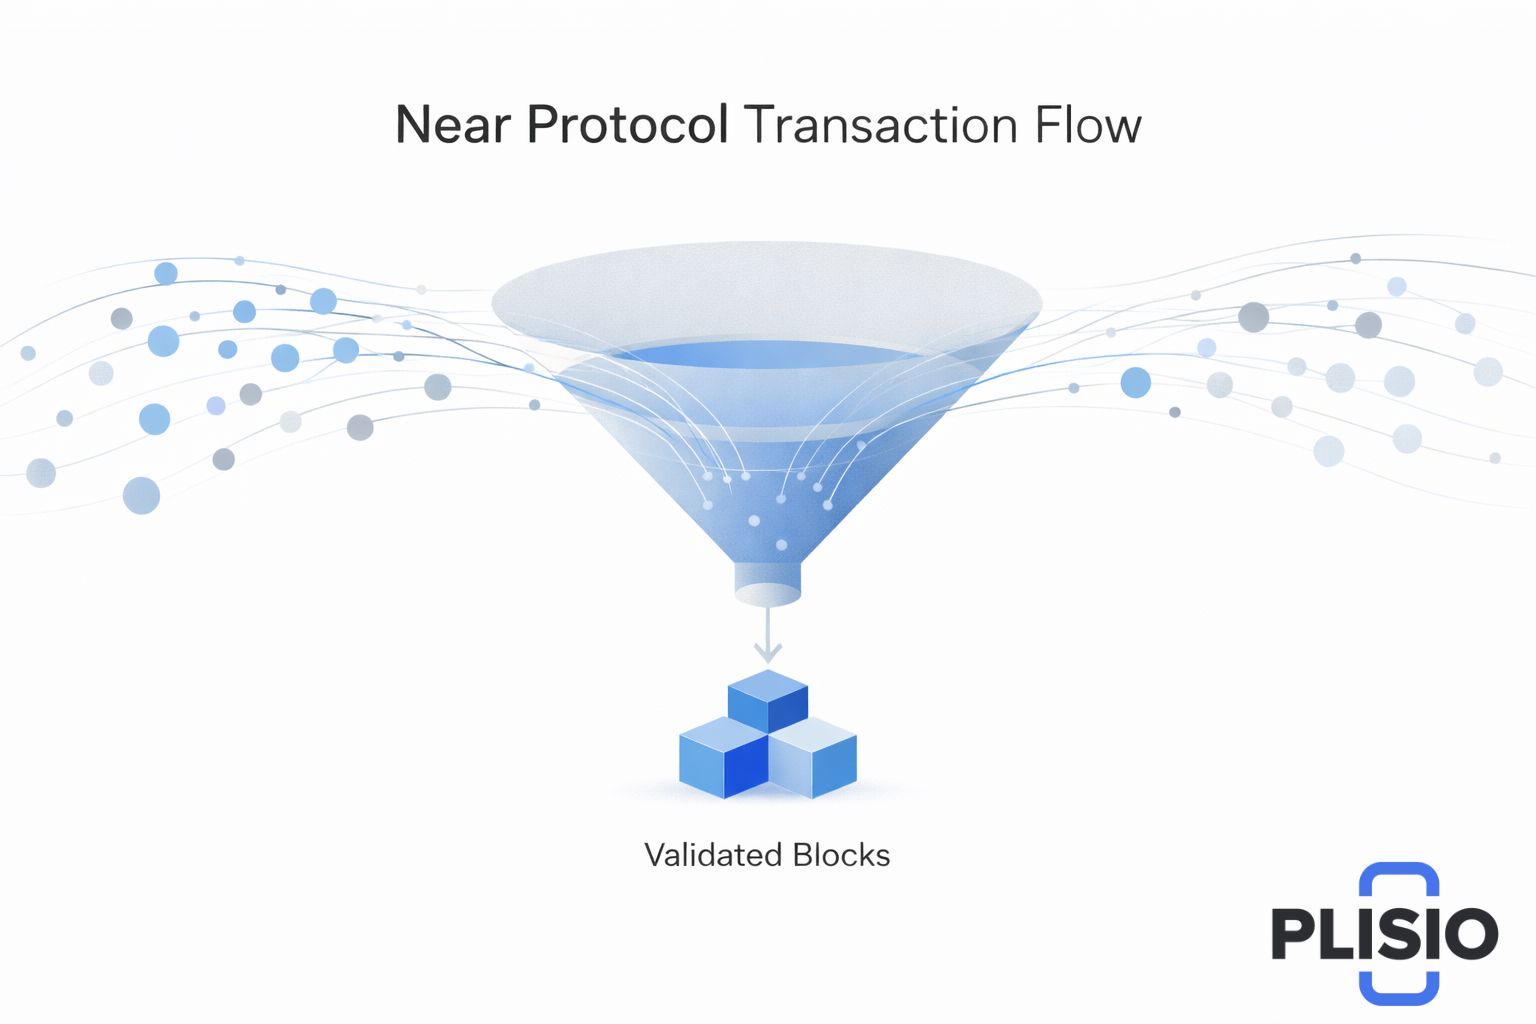
Near Protocol is a modern layer‑1 blockchain designed for usability, speed, and developer adoption. In simple terms, near protocol is the blockchain that aims to make Web3 feel as seamless as Web2. It uses dynamic sharding to improve scalability, low transaction fees to encourage everyday use, and a proof‑of‑stake consensus to secure the network. As a result, the project has become a recognizable digital asset in the cryptocurrency market, attracting developers building decentralized applications and users who want fast and low‑cost ways to transact.
This article presents a structured near protocol price prediction based on market structure, technical indicators, historical trends, and macro conditions in the broader crypto market. The goal is not to offer investment advice, but to explain how analysts estimate future value and what factors may shape the price of near protocol across several time horizons, including price prediction 2026, price prediction 2027, price prediction 2028, 2030, 2031, and even 2040.
Current Market Overview
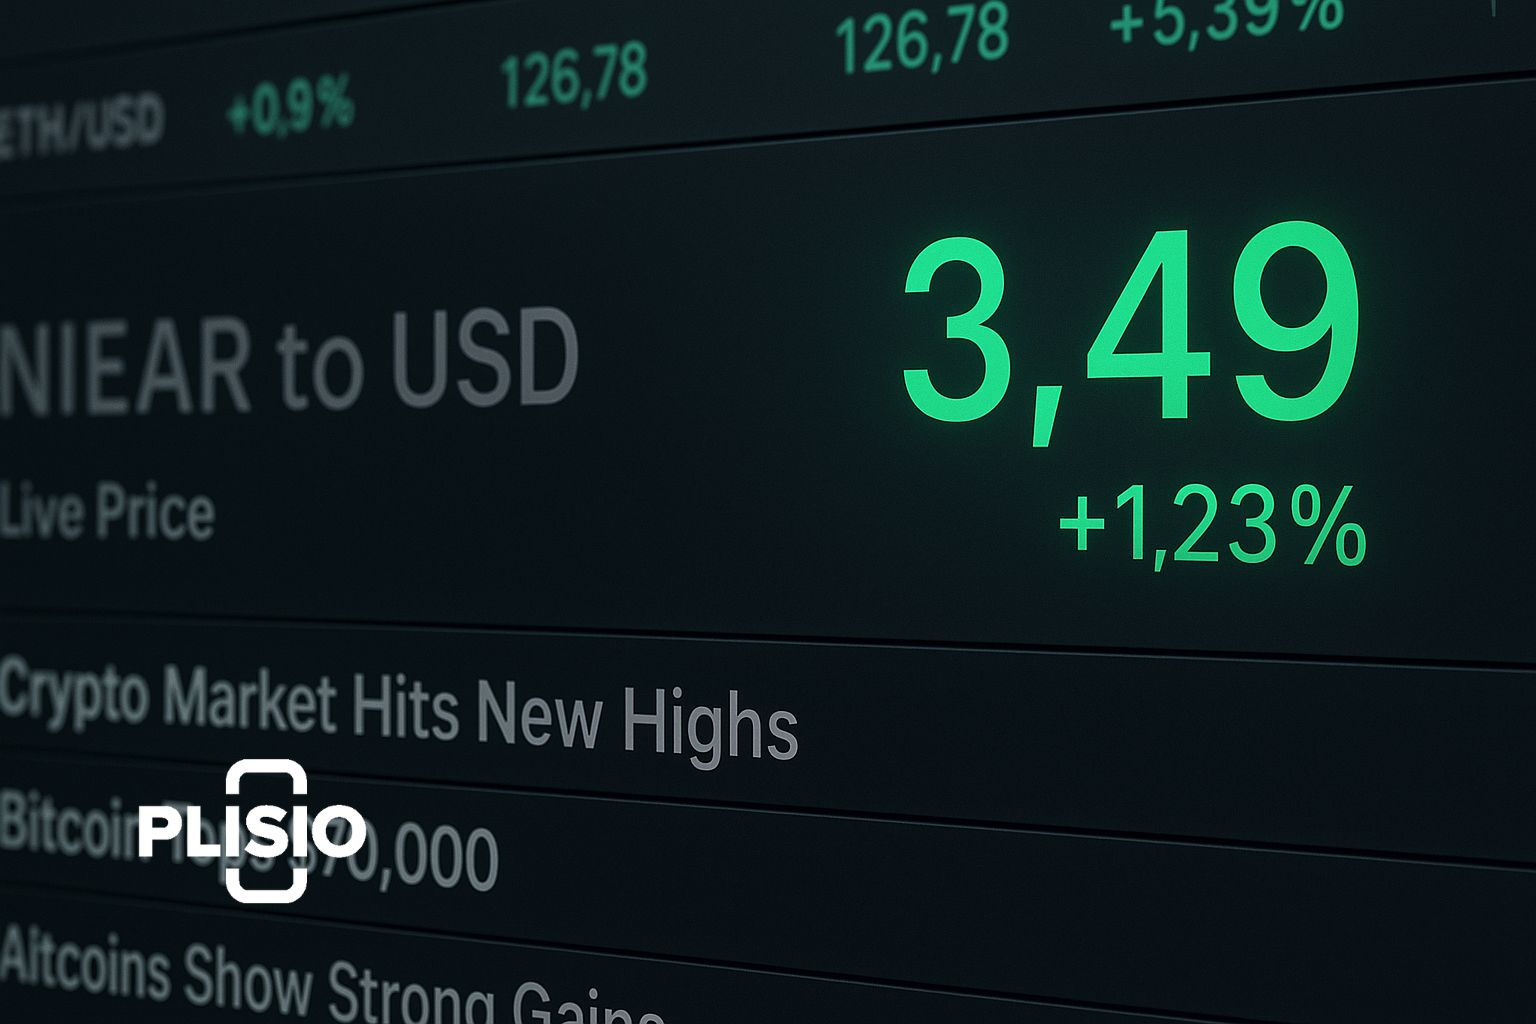
At the time of writing, the near protocol price today is close to the recent range observed over the last 7 days, showing moderate volatility and mixed market sentiment. The current price of near protocol reflects a balance between cautious buyers and sellers waiting for clearer signals from the broader cryptocurrency market.
The live price and live near quotes are typically taken from aggregated exchanges. This market price is influenced by global trading activity, macroeconomic news, and shifts in risk appetite in the crypto market.
Market Snapshot Table
|
Metric |
Value |
|
near protocol price today |
$1.5–$1.6 |
|
market capitalization |
Mid‑billion USD range |
|
market cap rank |
Top 50 assets |
|
volatility |
Medium |
|
Dominant trend |
Neutral to slightly bearish |
The near protocol market is still closely tied to Bitcoin and Ethereum cycles. When the broader crypto market turns positive, altcoins such as NEAR usually follow with higher price movements.
Historical Context and Price Behavior
Understanding historical price and price history helps explain how investors react to news and network development. NEAR experienced strong speculative growth during earlier bull cycles, followed by retracements typical of the cryptocurrency price pattern across most layer‑1 tokens.
The price chart over multiple years resembles a line chart with sharp peaks and valleys. These swings demonstrate how sensitive the asset is to both hype and fear. Such price action is common for emerging cryptocurrency projects that depend on ecosystem growth rather than traditional cash flows.
From a structural view, NEAR’s tokenomics include staking rewards and controlled issuance. The supply of near is capped by design, with emissions decreasing over time. Analysts often track billion near tokens in circulation and compare them with demand from users and validators.
Technical Analysis and Indicators
Short‑term forecasts rely heavily on technical analysis. Traders observe moving averages, oscillators, and trend channels to detect whether momentum is turning bullish or bearish. Common technical indicators include the Relative Strength Index, Moving Average Convergence Divergence, and Fibonacci retracement levels.
Another important indicator is support and resistance. Support zones show where buyers historically entered the market, while resistance marks levels where sellers previously dominated. These zones often guide trade near strategies and help explain short‑term price movements.
A simplified reading of NEAR’s chart suggests consolidation. This means the asset is building a base where supply and demand temporarily balance. When this balance breaks, the predicted price change can be rapid.
Near Protocol Forecast: 2026–2028
Most medium‑term models combine technical data with macro assumptions. The forecast for near protocol assumes continued development, gradual user growth, and no major security failures.
Near Protocol Price Ranges
|
Year |
Conservative Scenario |
Optimistic Scenario |
|
2026 |
$1.5–$2.5 |
$4–$6 |
|
2027 |
$1.6–$3.0 |
$5–$7 |
|
2028 |
$2.0–$3.5 |
$6–$8 |
These projections show how wide the range can be. In terms of price, much depends on whether adoption accelerates and whether capital returns to altcoins. Some models state that near is expected to follow overall market expansion, while others remain cautious.
The phrase near protocol would reach higher levels only if network usage grows significantly. In that case, price is expected to reach resistance levels that previously acted as ceilings.
Long‑Term Outlook: 2030, 2031, and 2040
Long‑term scenarios depend less on charts and more on fundamentals. By 2030, analysts consider whether NEAR can compete with other layer‑1 networks and position itself as infrastructure for web3 and possibly blockchain for ai use cases.
Some long‑range projections suggest that near protocol be worth double‑digit prices if the ecosystem becomes a hub for decentralized finance, gaming, and social applications. Other views assume modest growth as competition intensifies.
For 2031, growth models still point to gradual appreciation rather than explosive expansion. For 2040, any price forecast is speculative and mostly symbolic, reflecting the uncertainty of technology adoption over decades.
Fundamental Drivers
Several elements influence the near protocol’s price beyond speculation:
- On‑chain activity and user growth.
- Developer interest in building decentralized applications.
- Improvements in user experience and seamless onboarding.
- Perception of NEAR as a reliable digital asset within the broader crypto ecosystem.
The network’s design also emphasizes simplicity. This is what makes near attractive to developers who want readable smart contracts and predictable fees.
Market Psychology and Sentiment
Market sentiment can overpower fundamentals in the short run. A positive narrative around layer‑1 scalability can drive a bullish price, while fear from regulatory news can quickly push values down. Investors track social metrics, funding rounds, and developer updates as indicators of future performance.
Because of this emotional layer, price could deviate from any rational valuation model. That is why professional analysts avoid absolute certainty when publishing a near protocol prediction.
Practical Use and Adoption
NEAR is designed to let users send value and interact with smart contracts easily. The protocol supports wallet‑based accounts, human‑readable names, and fast finality. These features encourage people to explore near and experiment with new tools.
Real‑world utility matters because sustained usage drives long‑term demand. If more users pay fees, stake tokens, and build services, the near cost of transactions remains low but the network’s perceived value grows.
Key Considerations for Investors
Before deciding to buy near, traders and long‑term holders usually evaluate several points:
- Network growth compared to rival blockchains.
- Token emission rate and staking participation.
- Correlation with Bitcoin and Ethereum cycles.
- Regulatory environment affecting cryptocurrency markets.
This is why forecasts are often paired with disclaimers. No price prediction tool can fully capture geopolitical risk, exchange failures, or shifts in user behavior.
Summary of Price Outlook
- Near protocol price prediction models vary widely by timeframe.
- Medium‑term views for 2026 and 2027 suggest cautious optimism if the market recovers.
- Long‑term views for 2030 and 2031 depend on adoption and relevance in Web3.
- Ultra‑long forecasts such as 2040 are speculative by nature.
In short, near protocol's price reflects both technology progress and the emotional cycles of the cryptocurrency market. Analysts continue to refine their near protocol forecast as new data becomes available.
This expanded article integrates technical context, market data, and long‑term scenarios while reflecting how analysts approach near price, near price prediction, and the evolving role of NEAR within the global crypto market.