Hedera Hashgraph (HBAR) Price Prediction: 2026-2030

The crypto world continues evolving rapidly, and investors constantly search for reliable signals. This article explores hedera hashgraph price prediction, current price action, and long-term outlook using technical analysis, adoption metrics, and macro crypto market trends. The goal is to present realistic forecasts based on historical data, market structure, and analyst expectations valid for 2026.
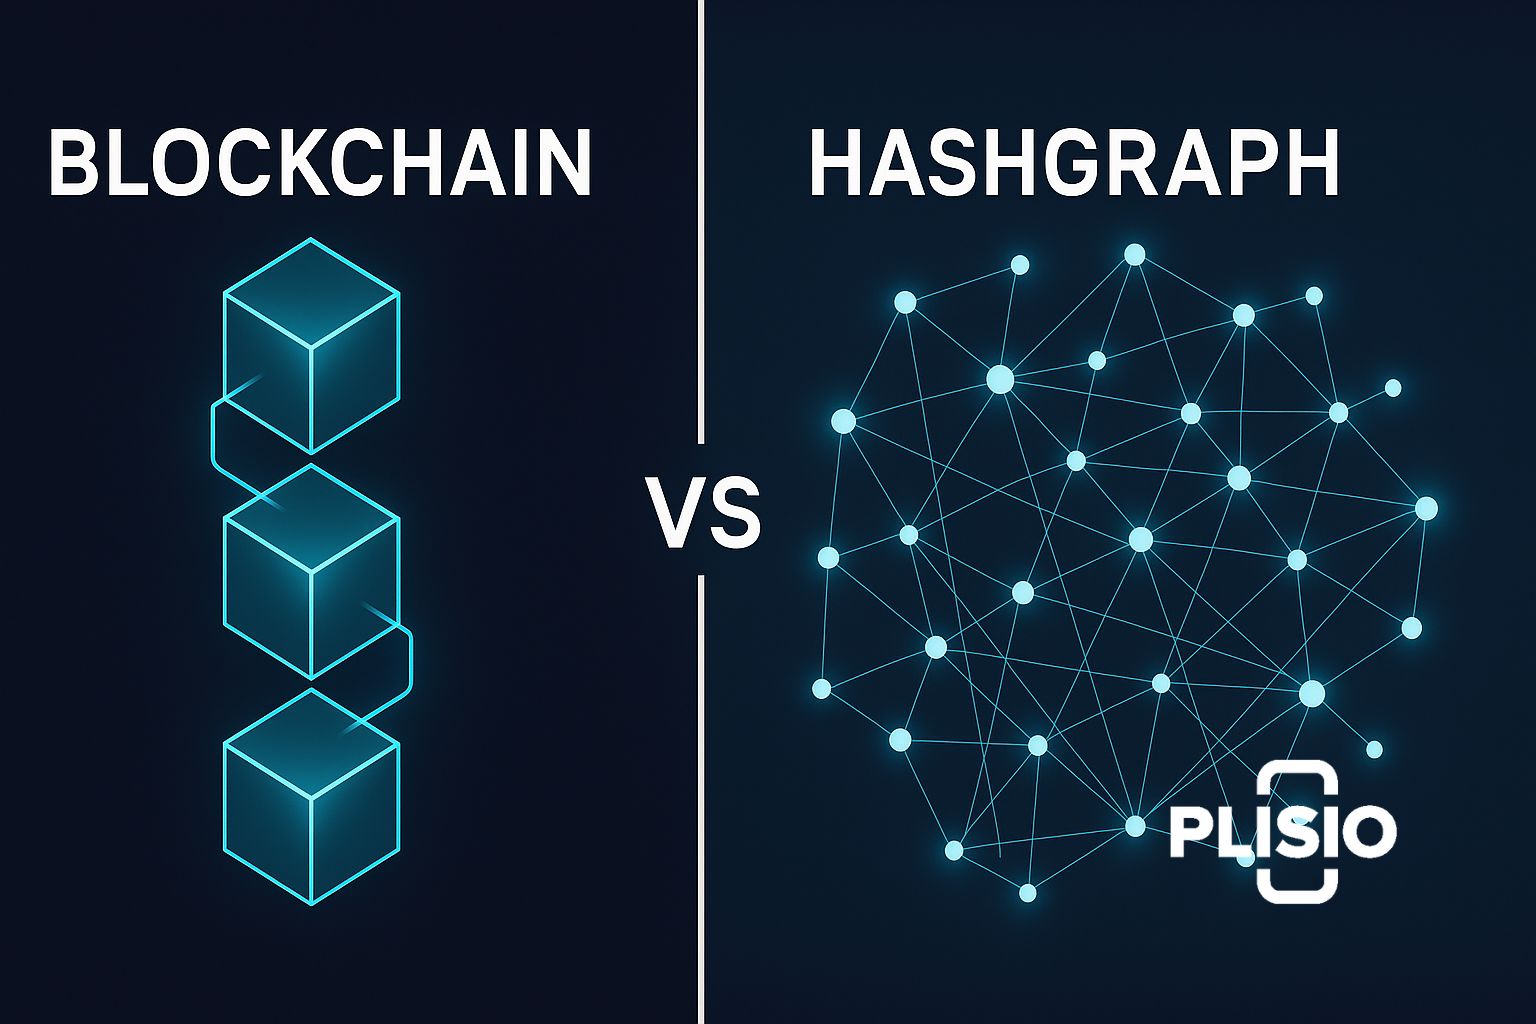
Hedera is widely discussed across the crypto world because hashgraph is a distributed ledger that differs from traditional blockchain infrastructure. Instead of storing blocks sequentially, the network uses a patented hashgraph structure enabling high performance and security.
What Is Hedera Hashgraph and How It Works
Hedera hashgraph is a public distributed ledger technology platform designed for enterprise-grade applications. The hedera network is governed by the hedera governing council, a global group of organizations responsible for network direction and stability.
The system is built using hashgraph technology, often described as an evolution beyond classic blockchains. Hedera uses the hashgraph consensus algorithm, enabling fast finality and strong security guarantees.
Hashgraph is a distributed ledger optimized for performance. The patented hashgraph approach allows extremely high throughput. The underlying hashgraph consensus ensures finality in seconds.
Hedera can process very high transactions per second, far above many blockchains. This makes hedera coin attractive for enterprise integrations.
The network supports smart contracts, tokenization, identity services, and messaging layers. These features position hedera hbar as infrastructure inside projects in the crypto ecosystem.
Hedera Historical Price and Price History Overview
Understanding historical price behavior helps evaluate future price forecast scenarios. The price history of HBAR shows correlation with the broader crypto market.
The historical price trend showed recovery attempts in 2024 after macro market corrections. During previous market cycle, price movements were tied to institutional sentiment and liquidity flows.
Previous price action shows consolidation phases followed by volatility spikes during adoption news cycles. The price chart shows clear support and resistance structures.
Current Market Conditions and Technical Analysis
The current market structure suggests mixed signals across major indicators. Technical analysis models currently show neutral momentum.
Analyst models track RSI, MACD, and volume patterns as primary indicator signals. Chart patterns indicate sideways accumulation.
The price of hedera hashgraph remains sensitive to broader crypto market sentiment. Crypto experts suggest monitoring adoption metrics rather than speculation alone.
Hedera Hashgraph Price Prediction 2026
The hedera hashgraph forecast for 2026 varies depending on macro conditions, adoption speed, and liquidity.
Hedera Price Forecast Table (2026)
|
Scenario |
Minimum Price |
Average Price |
Maximum Price |
|
Conservative |
$0.10 |
$0.105 |
$0.12 |
|
Growth Scenario |
$0.12 |
$0.50 |
$0.93 |
|
Extreme Cycle |
$0.60 |
$0.90 |
$1.02 |
This price prediction 2026 reflects possible volatility bands. Some forecasts for 2026 show moderate growth only.
Most models suggest hbar is expected to trade within wide volatility bands. Some analysts say price may remain range-bound if adoption growth is slow.
The average price varies across models, but most agree price could increase with real network usage.
Price Prediction previous market cycle Context
The price prediction previous market cycle suggested moderate recovery across many crypto assets. Many projections expected hedera price stabilization before expansion.
This historical context helps explain current price movements entering 2026.
Hedera Hashgraph Price Prediction 2027 and 2028
Mid-Term Forecast Table
|
Year |
Expected Price Range |
|
price prediction 2027 |
$0.095 – $1.84 |
|
price prediction 2028 |
$0.30 – $1.20 |
Mid-term forecast models assume stronger enterprise adoption and expansion of distributed ledger use cases.
Price Prediction 2030 Long-Term Outlook
The price prediction 2030 varies widely. Some aggressive models suggest major growth potential by the end of 2030.
Other conservative models suggest gradual adoption-driven price growth.
Whether hedera succeeds depends on real-world usage, enterprise integration, and developer ecosystem expansion.
Technology Advantages and Hashgraph Tech Strength
Hashgraph tech is designed to solve scaling and fairness issues. Hashgraph uses asynchronous Byzantine fault tolerance. Hedera uses council governance for stability and compliance.
The governing council structure is unique among distributed ledger projects.
Many believe hbar can benefit from enterprise demand for predictable fees and finality.
Hedera Adoption and Enterprise Use Case Growth
The hedera network continues expanding partnerships. Including hbar in enterprise payment flows increases long-term demand potential.
Some optimistic hedera hashgraph forecast models assume enterprise usage growth will drive price appreciation.
Can HBAR Reach $1 or More?
Some models suggest hbar reaching $1 is possible during strong market cycles. Other models say slower adoption will delay price expansion.
Hbar coin is likely to follow real transaction demand rather than speculation cycles.
Some projections say hbar is expected to trade near key resistance zones before major breakouts.
Risks and Market Uncertainty
The broader crypto market remains volatile. Bearish pressure can emerge from macro liquidity tightening.
Bullish momentum depends on real adoption and investor demand.
Market Drivers That May Influence Hedera Price
- Enterprise adoption expansion
- Crypto institutional investor entry
- Potential hbar etf speculation
Key Risks That May Slow Growth
- Token supply unlock pressure
- Competition from newer distributed ledger technology platforms
Hedera Ecosystem Outlook
Hedera hashgraph has a chance to become enterprise infrastructure if adoption continues. The hedera hashgraph’s architecture is designed for long-term scalability.
Hedera’s hashgraph structure enables consistent performance and network stability.

Investment Considerations
Some investors buy hedera hashgraph based on long-term adoption expectations. Others prefer to buy hedera during consolidation phases.
Before investing, investors should find a crypto aligned with their risk tolerance.
Final Hedera Hashgraph Price Prediction Summary
The hedera hashgraph price prediction ranges vary widely across models.
- Short-term price range: $0.08 – $0.16
- 2026 forecast range: $0.10 – $0.50 typical models
- Aggressive cycle scenario: potential move toward $1
- Long term price prediction 2030 range: $0.35 – $2 depending on adoption
Most models agree price is expected to show consistent growth over the next market cycles if adoption continues.
The price of hbar remains dependent on network usage growth and enterprise adoption.
Conclusion
The hedera hashgraph price remains tied to real-world adoption. The price of hbar depends on usage metrics, developer ecosystem expansion, and macro crypto cycles.
Many crypto experts believe hbar could grow if enterprise integration accelerates. However, price forecast models must always be viewed as probability scenarios, not guarantees.
In the long run, the success of hedera depends on whether hedera can become infrastructure for global distributed ledger applications.