Best Dividend Stocks 2026: High-Dividend Sector Portfolio Picks

The spread between the 10-year US Treasury and the S&P 500 dividend yield is now about 344 basis points. Treasuries pay roughly 4.48%; the broad index pays roughly 1.04%, which is a near-50-year low. For anyone buying the best dividend stocks for income alone, the index is a worse trade than government paper. That single fact reframes the whole question of how to build a dividend-paying portfolio in 2026.
Why Best Dividend Stocks Pay in a 3.75% Fed World
The Fed cut interest rates by 175 basis points between September 2024 and December 2025. The federal funds rate now sits at 3.50–3.75% and the FOMC has projected only one further 25 bps cut for 2026 and one for 2027. That ended the great refinancing window for rate-sensitive equities and left dividend investors in an awkward middle. Rates are no longer punitive, but they have not collapsed back to the post-COVID floor that turned every income-paying stock into a bond proxy.
In that environment, the broad market dividend yield says almost nothing useful. The S&P 500 yield of 1.04% (Multpl.com, May 26, 2026) is the artefact of a market dominated by Microsoft, Apple, Nvidia, Alphabet, Meta, and Amazon. Six names. Most pay a token dividend or none. The rest of the index has the kind of yields people actually associate with dividend investing, but those are masked at the headline level.
Hartford Funds publishes the most quoted long-run number in this field: since 1960, reinvested dividends and compounding have accounted for about 85% of the S&P 500's cumulative total return. That number is not an argument for buying the S&P 500 for yield today. It is an argument for buying dividend-paying companies systematically, holding them, and reinvesting. The mechanism is identical whether the starting yield is 1% or 5%; the compounding rate is what does the work.
The practical takeaway: in 2026, the 344-basis-point spread between Treasuries and the index makes individual stock selection more consequential than at any point in the past decade. A high-quality payer above 3% offers something Treasuries do not, which is dividend growth and equity appreciation. A high-yield trap above 7% offers something Treasuries do not, which is a permanent loss of principal. The job of the rest of this guide is to draw that line clearly.
Three Metrics Every Stock Must Pass to Pay Dividends
Yield is the loudest number on a dividend stock screener, and on its own it is the worst signal. Intel had a thirty-year dividend track record, an unremarkable yield, and suspended its payout in the fourth quarter of 2024 anyway. Behind every cut is a set of metrics that flashed yellow long before the announcement.
Three numbers matter most. The first is payout ratio, the share of earnings paid out as dividends. Under 60% gives the company room to absorb a bad year, raise the dividend through a downturn, or fund growth without borrowing. Over 80% on trailing earnings is a warning, because the next earnings dip leaves no buffer. The 2025 S&P 500 average payout ratio was 32.28% (Hartford Funds), well under the 99-year average of 55.72%, which means the index as a whole has room to grow distributions if it wants to. The second is free cash flow coverage. Earnings can be smoothed; cash either arrives or does not. Negative FCF with a maintained dividend is borrowed time. The third is the dividend growth streak itself, less because a streak guarantees anything and more because a board that has raised the payment for 25 or 50 years has built institutional discipline around it.
Aristocrats and Kings: 2026's Top and Highest-Dividend Streaks
The S&P 500 Dividend Aristocrats index reached 69 companies after the January 2025 rebalancing, the largest cohort on record. Then the January 2026 rebalancing made zero changes, the first time that has happened. Two readings are available. One is that the cohort has matured, with no fresh candidates ready to clear the 25-year bar. The other is structural: corporate dividend culture in the United States changed during the buyback decade of the 2010s, and the pipeline of new Aristocrats has thinned out as a result. Both are partly true.
The 2025 additions were Erie Indemnity (ERIE), Eversource Energy (ES), and FactSet Research Systems (FDS). Eversource is the interesting one for the rate-cycle thesis below. The narrower Dividend Kings list, which requires 50 consecutive years of increases, holds 57 stocks as of May 2026, with an average yield of 4.05%, average payout ratio of 59.17%, and 5-year dividend CAGR of 5.97% (Sure Dividend, Finance Charts). Numbers that look boring on paper are exactly the point — and for any shareholder who reinvests through a full cycle, they compound into the portfolio's largest line item.
The table below is the working list most US dividend portfolios start from.
| Ticker | Company | Sector | Yield | Payout | 5Y CAGR | Streak |
|---|---|---|---|---|---|---|
| KO | Coca-Cola | Staples | 2.60% | 66.7% | 4.46% | 64 |
| JNJ | Johnson & Johnson | Healthcare | 3.20% | 59.5% | ~5–6% | 64 |
| PG | Procter & Gamble | Staples | 2.91% | 61.2% | ~4–5% | 70 |
| PEP | PepsiCo | Staples | 4.01% | 64.6% (fwd) | 6.93% | 54 |
| MCD | McDonald's | Discretionary | 2.43% | 59.6% | 8.10% | 50 |
| ABBV | AbbVie | Healthcare | 3.33% | 65.0% | 6.60% | 52 |
| MO | Altria | Staples | 6.29% | 87.7% | ~5% | 18 |
| O | Realty Income | REIT | ~5.0% | n/a | ~3–4% | 31+ |
| CVX | Chevron | Energy | ~4.2% | — | — | 38 |
Source: MarketBeat, GuruFocus, Koyfin, JNJ investor.jnj.com, May 2026.
Yield vs Dividend Growth: Two Bets on Current Dividend Yield
The choice between high-yield and dividend-growth stocks is usually presented as a portfolio-construction question — and for investors targeting passive income, the answer looks different than it does for those chasing total return. It is more often a question about who is reading the article. Two examples make this concrete.
Apple grew its dividend roughly 900% over the past ten years (24/7 Wall St., April 2026). Its current yield is 0.36%. For a 35-year-old building a thirty-year position, that compounding curve is what matters; the starting yield is irrelevant. Altria yields 6.29% today, with a payout ratio of 87.7% and a secular volume decline in cigarettes. For a 67-year-old who needs the cheque this quarter, the high current yield is what matters; the growth curve is irrelevant. Microsoft sits in between at 0.87% yield with 24 consecutive years of increases, and PepsiCo is the rare middle-ground name with a 4.01% yield and a 6.93% 5-year growth rate.
The mistake is buying high-yield with a thirty-year horizon, because secular decline eventually breaks the payment, or buying low-yield growth with a retirement-income horizon, because the compounding does not arrive in time to live on. Both kinds of stock are correct answers. They answer different questions.
Sector Rotation: Where Current Dividends Live After Cuts
The Fed's 175-basis-point cut cycle reshaped where dividend income actually sits in the US market. Three rotations matter.
Utilities are back. Lower borrowing costs help capital-intensive utilities directly, and the AI data-center build-out has produced the first secular load-growth story for US utilities in a generation. Eversource Energy joining the Dividend Aristocrats in January 2025 was an early signal that the income market was repricing the sector. REITs were the other clear beneficiary; Nareit data cited in coverage of the cycle pegged US REITs at roughly 9.5% annualized total return in the twelve months following past Fed rate-cut cycles, ahead of broad equities. Realty Income (O), a net-lease REIT with a 31-year monthly payment streak, sits near the centre of that bucket.
Energy dividends have not disappeared but have concentrated, and the investment case now rests almost entirely on supermajor balance sheets rather than the broader industry. Chevron is the sole Energy Aristocrat and yields about 4.2%. Smaller energy names have largely cut or capped payments through the volatile post-2022 price cycle, leaving the supermajors as the practical option for yield exposure in the sector.
Technology is the surprise. The sector spent the 2010s as a dividend desert. Then Meta initiated a $0.50 quarterly dividend in the first quarter of 2024 alongside a $50 billion buyback authorization. Alphabet declared its first-ever dividend in April 2024. NVIDIA now pays a small quarterly dividend of $0.25. None of these are yield plays at headline rates around 0.4–0.9%, but their aggregate weight in the S&P 500 explains why the index yield finally inflected upward at the margin after a decade of decline.
| Sector | Average yield 2026 | Notes |
|---|---|---|
| REITs | 4–5% | O at ~5%, FRT at 4.3% |
| Energy | ~4.2% | CVX sole Aristocrat |
| Utilities | 3.7–3.96% | Rate-sensitive, AI power demand |
| Consumer Staples | ~2.5% | PEP 4.01%, KO 2.60% |
| Financials | ~2.5% | Wide dispersion |
| Healthcare | 1.75–2.28% | JNJ at 3.20% well above sector |
| Technology | <1% | MSFT 0.87%, AAPL 0.36%, NVDA 0.46% |
| S&P 500 | 1.04% | Near 50-year low |
Source: Dividend.com sector data, Multpl.com, MarketBeat, MacroMicro, May 2026.
Dividend ETFs Worth the Expense Ratio in 2026
For most readers the answer is one fund. SCHD yields 3.24%, charges 0.06% in expenses, holds $95.2 billion in assets, and has delivered a 12.91% annualized total return over the past ten years (StockAnalysis.com, May 2026). VYM is the steadier sibling at 2.22% yield, 0.04% expense, and 11.83% over ten years. DVY is older, costlier at 0.38%, and increasingly hard to defend on either basis.
SCHD's edge is also its risk. The March 2026 reconstitution added 25 names and removed Cisco and AbbVie, and the 2025 reconstitution had been more disruptive, dropping financials from 17.2% to 8.5% of the fund and lifting energy from 12.2% to 21%. That energy weighting is largely why SCHD beat VYM by about 2.8 points over the past twelve months. Indexing is not the same as passive risk.
| ETF | Yield | 1Y | 5Y ann. | 10Y ann. | Expense | AUM |
|---|---|---|---|---|---|---|
| SCHD | 3.24% | +30.57% | 8.81% | 12.91% | 0.06% | $95.2B |
| VYM | 2.22% | +27.76% | 11.50% | 11.83% | 0.04% | $78.5B |
| SPY | ~1.2% | — | — | ~10% | 0.09% | — |
| DVY | — | — | — | — | 0.38% | — |
Source: StockAnalysis.com, May 2026. DVY return data unavailable at publication.
Yield Traps: Spotting a Cut Before Annualized Payouts Drop
Every high-profile dividend cut of the past four years had at least eighteen months of warning visible to anyone reading the financials — making them the most avoidable traps on any list of top dividend stocks.
Intel suspended its quarterly $0.125 dividend in the fourth quarter of 2024, ending a thirty-year track record (Yahoo Finance, August 2024). Revenue had been falling, free cash flow had turned negative, and the manufacturing reinvestment cycle had broken the math. 3M cut in May 2024 after 67 consecutive years, formally because of the Solventum spin-off, structurally because the payout ratio on remaining earnings was no longer sustainable. AT&T cut by 47%, from $2.08 to $1.11 annual, in February 2022 alongside the WarnerMedia spin-off; the yield had been signalling distress above 6% for two years.
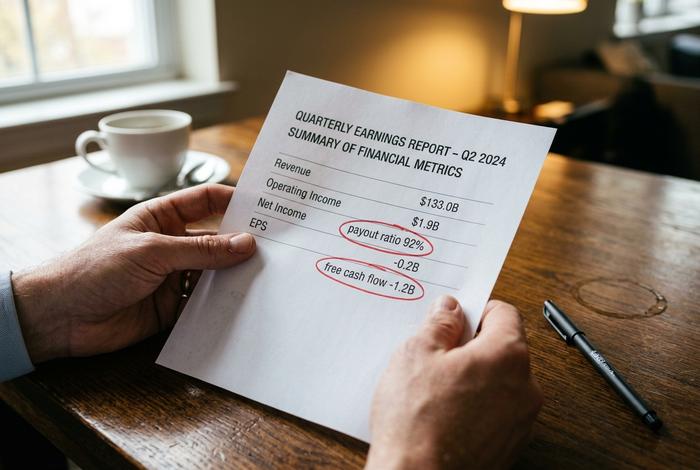
The pattern is three flags converging. First, yield drifting up while the share price drifts down: the math forces it, but it is a symptom, not a verdict. Second, payout ratio above 80% on trailing earnings. Third, negative or sharply declining free cash flow. Any one alone is colour. All three together is a sell. On the current watchlist, PepsiCo's trailing payout ratio at 92.94% bears monitoring (forward improves to 64.56% on earnings estimates), and Altria's 87.7% has been elevated for years against a declining-volume business.
Tax Treatment of Dividend Payments in 2026
Dividend income is also one of the few categories that offers a partial inflation hedge, because quality payers raise distributions over time. The single biggest tax decision in a dividend portfolio is REIT placement. REIT distributions are taxed as ordinary income at marginal rates up to 37%, not at the qualified-dividend rates of 0%, 15%, or 20%. Holding REITs in a traditional IRA or Roth removes that drag entirely. Everything else is secondary.
Qualified-dividend brackets for 2026 stand at 0% for single filers up to $49,450 (married filing jointly up to $98,900), 15% in the middle band, and 20% above $545,500 single / $613,700 MFJ, with an additional 3.8% Net Investment Income Tax above $200K/$250K MAGI (Fidelity, 2026). The TCJA qualified-dividend rate structure was made permanent under OBBBA and is no longer set to sunset.
How to Build a Dividend Stock Portfolio: Three Ways to Invest
Nobody needs to own thirty dividend stocks to do this well. Three baskets, ranked by how much work you want to do:
One fund and done. SCHD or VYM as the entire dividend allocation. Reinvest automatically through a DRIP. This captures roughly the same compounding curve that drove the Hartford 85% figure.
ETF plus a handful of Kings. The core fund plus four to six Dividend Kings chosen for sector balance: a staple (KO, PG, PEP), a healthcare name (JNJ, ABBV), a financial, an industrial, an energy supermajor (CVX). This adds tracking error and concentration risk; it also adds conviction.
ETF plus a yield kicker. The core fund plus one or two higher-yield names for current income: a REIT (Realty Income), an MLP, or a supermajor. This raises the portfolio's running yield without leaving the broad-quality framework. The bad answer in 2026 is the inverse: ten high-yield individual stocks with no ETF backbone. Diversification across sectors is not optional when you are living off the income; a single cut in a concentrated portfolio hurts immediately. That is concentration risk dressed up as income strategy. Whatever bucket you pick, the best dividend stocks for your portfolio are the ones whose payout you can defend against the next rate cycle, the next earnings miss, and the next spin-off.