Coinalyze Review: Futures Trading Data and Portfolio Insights

A candle moves and you have no idea why. That's a moment every futures trader eventually runs into, and it's a big part of why Coinalyze keeps getting mentioned in trading Discords and on Twitter. Price alone doesn't say who was positioned for the move, or how leveraged they were.
Coinalyze fills that gap. It's a free crypto analytics platform built around derivatives markets, pulling open interest, funding rates, liquidations, and order-flow data from more than a dozen exchanges into a single dashboard. Rather than checking each exchange on its own, you get one consolidated read on how the futures market is positioned, long, short, overleveraged, or calm, next to the price chart everyone already watches. Below: what it does, how it slots into a real futures trading workflow, where it holds up, where it doesn't, and how it compares to the handful of tools fighting for the same niche.
What Is Coinalyze and How Does It Work?
Gabriel Dodan, a Romanian software engineer based in Iași, launched Coinalyze back in January 2017. The company never tried to become a do-everything crypto app. It does one job, derivatives market data, and it does that job in real time, for free, straight in the browser.
Here's the mechanical part: Coinalyze plugs into the public APIs of major derivatives exchanges and normalizes what comes back into shared metrics. That matters more than it sounds like it should. Binance and Bybit don't report open interest or funding the same way, so without something doing that translation, you're stuck manually reconciling formats every time you want to compare them. Coinalyze handles that automatically, and because the connections stay live, positioning shifts show up in real-time instead of a few minutes late. No more tabbing between eight exchange dashboards just to check one number.
The interface is chart-first and doesn't try to be clever about it. Pick an asset, pick a metric, and it overlays on a standard candlestick view or sits underneath as its own panel. You don't even need an account to explore the free tier, which is one less barrier if you just want to check funding rates before placing a trade.
Key Features: Charts, Signals, and Liquidation Data
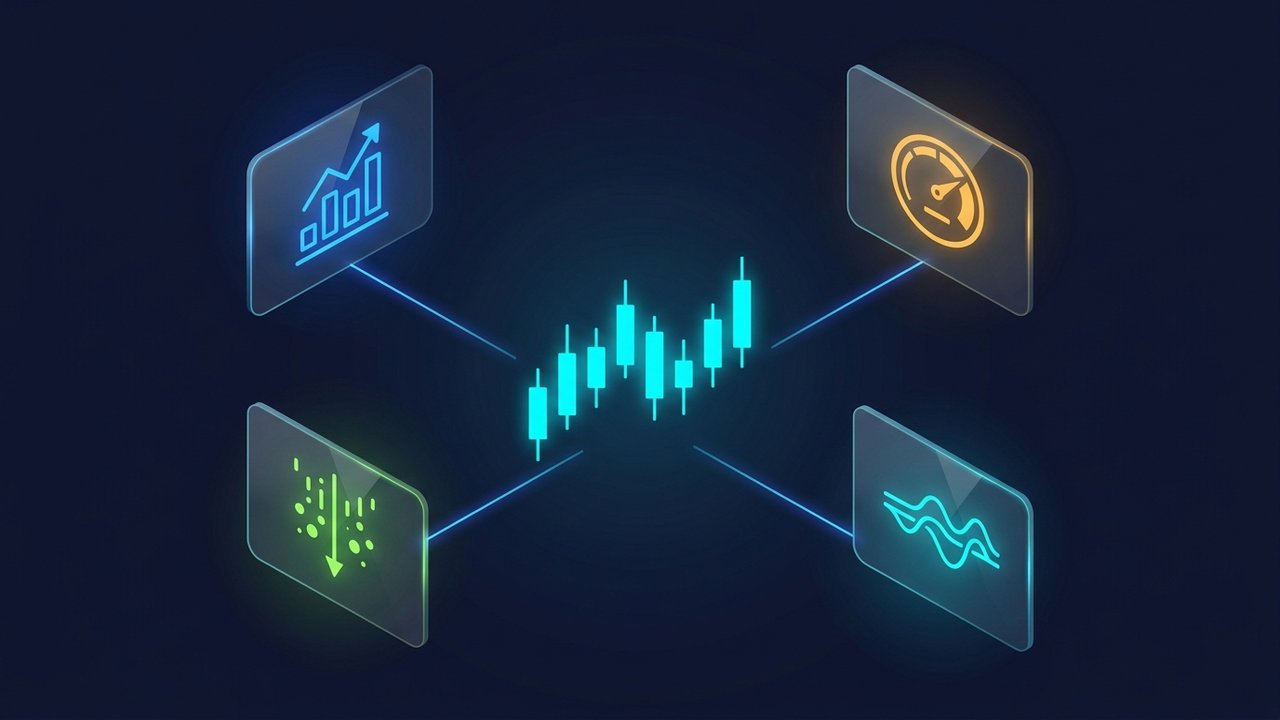
Coinalyze's value comes from the breadth of derivatives metrics it packages into one place, all delivered in real-time, not from any single flashy feature. The core set includes:
- Open interest tracking — total value of outstanding futures contracts per exchange and aggregated across all of them, updated in real time
- Funding rate data — both the current funding rate and a predicted rate for perpetual contracts, normalized across 1-hour, 8-hour, daily, and annualized intervals
- Liquidation feed — a live stream of forced liquidations by size and side, useful for spotting cascades before they show up as a price wick
- Cumulative Volume Delta (CVD) — a running measure of aggressive buying versus selling pressure, layered directly onto the price chart
- Long/short ratio — positioning splits by exchange, showing how crowded a trade has become
- Custom metric builder — lets a trader combine any two data streams into their own formula, rather than being limited to Coinalyze's presets
Most exchanges expose some of this data natively, so none of these metrics is unique to Coinalyze by itself. What's different is having open interest, funding, and liquidations from a dozen-plus venues sitting in one interface instead of a dozen browser tabs.
How Coinalyze Fits Into a Bitcoin Trading Strategy
On its own, a funding rate just tells you who's paying whom. It only gets useful once you read it against price and open interest together. Take Bitcoin: when funding runs sharply positive while price keeps grinding higher, that combo usually means leveraged longs, not spot buyers, are driving the rally, and that kind of setup has a history of ending in a sharp pullback once those longs get squeezed.
Flip it around and the logic holds. Deeply negative funding during a selloff means shorts are crowded and paying to stay in, which can set up a squeeze if price finds a floor. Coinalyze won't tell you which way it breaks. It surfaces the imbalance and leaves the call to you.
Then there's open interest, which adds another dimension entirely. Rising OI alongside rising price points to new money entering; rising OI alongside falling price points to fresh shorts piling in. Put OI delta next to a candlestick chart and a single price line turns into a rough map of who's actually pushing the move. This gets most useful when you're not just watching one asset in isolation but layering that positioning data across a broader portfolio, which is where futures trading tools like this pay off.
Reading Price Action With Coinalyze's Data
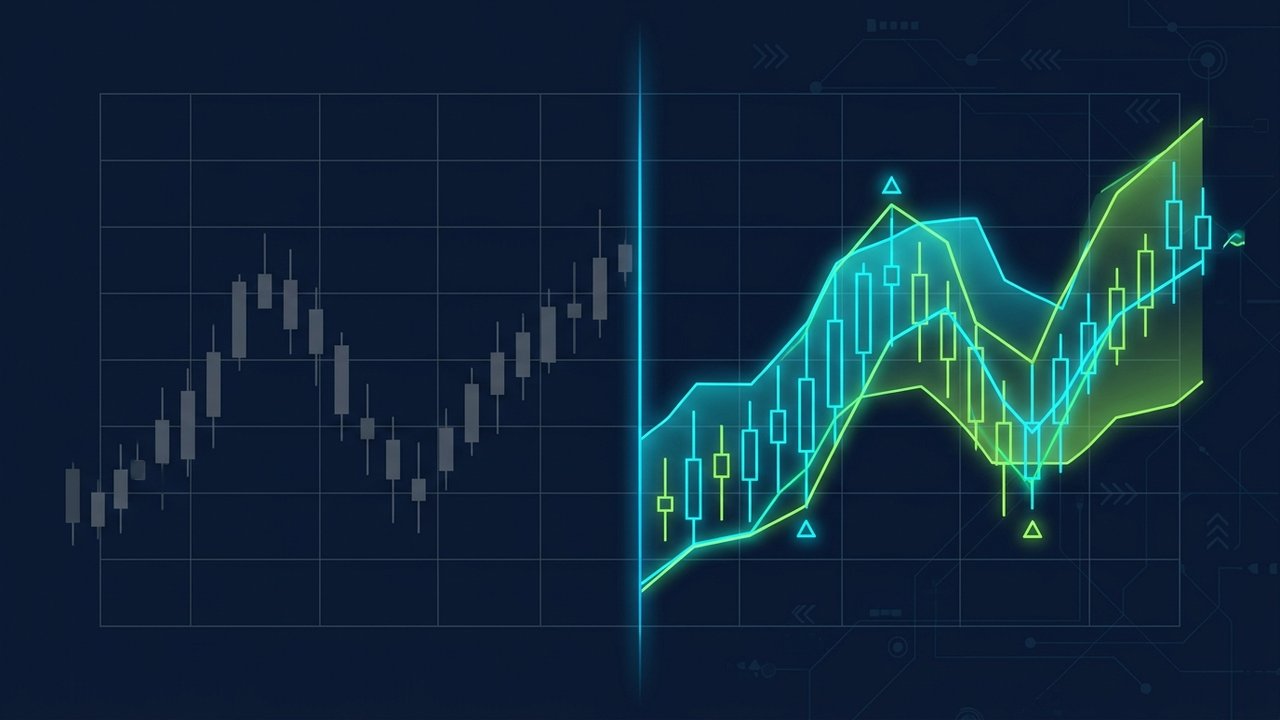
A bare price chart shows what buyers and sellers agreed on. It doesn't show how much leverage sat behind that agreement, or where the next forced liquidation cluster might sit. Coinalyze's liquidation heatmaps address that gap directly by estimating price zones where a meaningful volume of leveraged positions would be force-closed if price reached them.
Traders use this in a fairly mechanical way: identify a liquidation cluster above or below current price, then treat it as a magnet the market may be drawn toward, since cascading liquidations tend to accelerate a move once they start firing. CVD adds a complementary read. When price is flat but CVD is climbing, buyers are quietly absorbing supply, and that sometimes shows up as a breakout a price-only chart wouldn't have flagged in advance.
This isn't a crystal ball, and traders who treat it that way usually end up disappointed. It works best as a filter: does the derivatives picture support or contradict what the price chart is suggesting? Coinalyze sharpens that question. It doesn't answer it for you. For traders managing more than a single position, spotting these signals across a portfolio matters more than watching one chart alone.
Exchanges and Markets Coinalyze Covers
Coinalyze aggregates data from a dozen-plus major derivatives exchanges, covering the overwhelming majority of global futures volume. Coverage includes both perpetual and dated futures contracts across the venues below.
| Exchange | Contract types covered |
|---|---|
| Binance | Perpetual, dated futures |
| Bybit | Perpetual, dated futures |
| OKX | Perpetual, dated futures |
| BitMEX | Perpetual, dated futures |
| Hyperliquid | Perpetual |
| Kraken | Perpetual, dated futures |
| Gate.io | Perpetual, dated futures |
| Bitfinex | Perpetual |
| Bitget | Perpetual, dated futures |
| KuCoin | Perpetual, dated futures |
| HTX | Perpetual, dated futures |
| MEXC | Perpetual |
Spot market coverage is thinner by comparison. Coinalyze's center of gravity is derivatives, so traders looking for deep spot order-book analysis will find better tools elsewhere. For anyone whose trading is futures-centric, though, this exchange list covers nearly every venue worth watching.
Coinalyze Pricing: Free Plan vs API Access
The free tier is the main draw, and it isn't a stripped-down trial. It includes live charts, the core metrics listed above, and access to most exchanges without a paywall. That's unusual in a market where comparable derivatives dashboards often gate open interest or funding history behind a subscription.
Coinalyze also offers a free REST API for developers who want to pull futures market data programmatically rather than reading it off a dashboard. The API exposes endpoints for exchanges, markets, open interest history, funding rate history, and liquidation history, with a published rate limit of 40 calls per minute on the free tier. Paid plans exist for traders and teams who need higher API limits or more advanced tooling, which helps anyone tracking positioning across a broader portfolio rather than a single trade. Still, the free tier alone covers what most individual traders will ever need.
Strengths and Limitations for Active Trading
No analytics platform is a perfect fit for every trading style, and Coinalyze is no exception. It's worth being specific about where it earns its keep and where it doesn't.
Where it's strong:
- Deep, real-time derivatives data aggregated across a dozen-plus exchanges in one view
- A generous free tier that doesn't gate the metrics that matter most
- A free, well-documented API for traders building their own tools or dashboards
- A clean interface that doesn't require a steep onboarding process
Where it falls short:
- Minimal spot market analysis: this is a derivatives-first tool, not a general market data platform
- No built-in trade execution or brokerage. Coinalyze is a data layer, not a place to place orders
- Advanced metrics like CVD and custom formulas assume some existing derivatives knowledge, a real barrier for traders just getting started with futures trading
- As a small, focused company, feature releases move at the pace of a lean team rather than a well-funded platform
Coinalyze Alternatives Worth Comparing
Coinalyze isn't the only crypto analytics tool built around derivatives data, so it helps to know how it stacks up before making it a daily driver.
- CoinGlass — the closest direct competitor, with a similar focus on open interest, funding, and liquidations, plus a more built-out set of pre-made dashboards
- Glassnode — leans toward on-chain analytics rather than derivatives, better suited to longer-term positioning than intraday futures reads
- CryptoQuant — combines on-chain and exchange flow data, popular with analysts who want a macro view alongside derivatives metrics
- Laevitas — targets options and volatility traders more specifically than spot-adjacent futures traders
- TradingView (with derivatives add-ons) — the default charting platform for most traders, extendable with community scripts that approximate some of what Coinalyze does natively
The practical difference is scope: Coinalyze stays narrowly focused on futures market data and does that one thing thoroughly, while several alternatives spread across on-chain, options, and spot data as well. Traders who want derivatives context specifically, without paying for coverage of other markets, tend to gravitate toward Coinalyze or CoinGlass first.
Getting Started With Coinalyze Today
Coinalyze won't tell a trader what to do next, and that's really the point. As a crypto analytics tool built for derivatives, it's a data layer, not a decision engine. What it does well is remove the manual work of checking funding rates and open interest across a dozen exchanges one tab at a time, replacing that routine with a single dashboard that updates in real time. For anyone doing futures trading with any regularity, that alone tends to justify the free price tag.
Reading the market well is only half of running a crypto-facing business, though. Once positioning and timing decisions turn into actual transactions, whether that's accepting crypto payments, settling with partners, or moving funds across chains, the operational side matters just as much as the analytics. That's where a payment gateway built specifically for crypto, like Plisio, fits into the picture: giving traders and crypto businesses a reliable way to accept and manage crypto payments once the market read from tools like Coinalyze turns into a decision worth acting on.