What Is a Bear Flag Pattern?

In today's article, we'll delve deeply into one of the most reliable and frequently encountered continuation patterns in trading charts — the bear flag pattern. This pattern often appears during downtrends and is a crucial element for optimizing trading strategies.
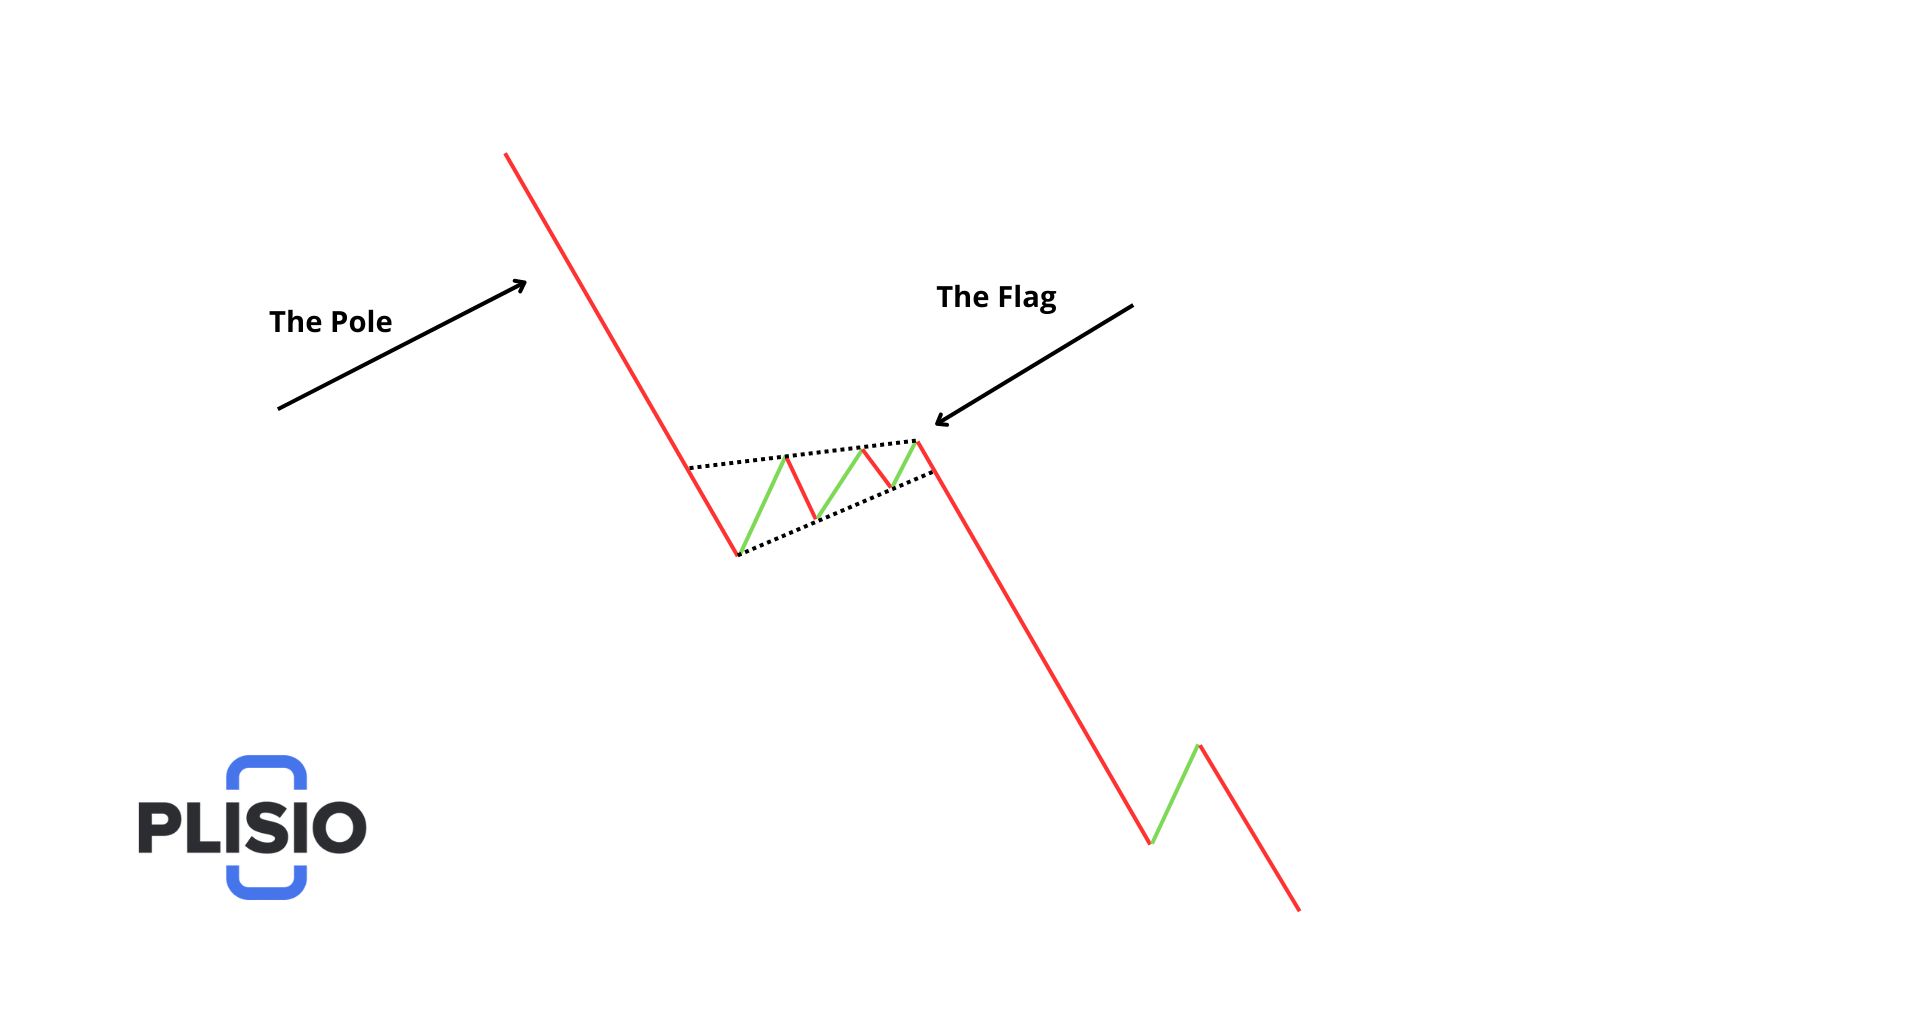
The bear flag is formed after a sharp price decline, followed by a period of consolidation. The pattern gets its name from its visual similarity to a flag on the chart, where a short upward price correction creates an illusion of a flag. This slight upward movement, however, often misleads traders into anticipating a price reversal, which is a common misconception. In reality, the price continues to move in the direction of the original trend after the pullback. The strong initial price drop forms the flagpole, which is essential for identifying the target after the flag breaks out to the downside.
Understanding how to trade the bear flag pattern effectively can significantly change your approach to trading, allowing you to better anticipate and capitalize on the market's movements. Join us as we explore the intricacies of the bear flag and how it can be a game-changer in your trading tactics.
What is a Flag in Technical Analysis?
The flag pattern is a technical indicator that suggests the continuation of an existing trend, whether upward (bullish) or downward (bearish). It is characterized by its occurrence during periods of high volatility and increased trading volumes.
This pattern can be observed across various markets, including Forex, cryptocurrencies, stocks, commodities, and over-the-counter markets.
The formation of a flag pattern begins with a significant price movement represented by several high-volume bars, known as the flagpole. This is followed by a short-term consolidation moving against the trend, forming the flag, after which the price resumes its trend movement, typically mirroring the length of the flagpole.
For traders, a bullish flag signals the likelihood of an ongoing uptrend, suggesting an opportunity to initiate a long position. Conversely, a bear flag suggests that the downtrend will continue. When analyzing charts, the flag pattern often works effectively when combined with other price action patterns.
What is a Bearish Flag Pattern?
The bearish flag pattern is a widely recognized technical analysis tool used to forecast the continuation of a downward trend in the market. This pattern comprises two main components: the flagpole and the flag. The flagpole is established by a steep decline in prices that marks the beginning of the formation. Following this drop, a period of consolidation occurs, forming the flag.
During this consolidation, there's a temporary reversal where buyers attempt to push the price upward, creating the high point of the flag. However, this rally is typically short-lived as the dominant bearish trend resumes. The pattern is completed when the price descends again, often mirroring the initial flagpole's length, thereby signaling a further continuation of the bearish trend.
Flag Formations in Technical Analysis
Flag formations are pivotal in technical analysis, offering insights into stock price movements. These patterns typically appear on charts after a significant price move, followed by a period of consolidation, creating a flag-like appearance. Understanding these formations is crucial for traders aiming to predict potential trend continuities or reversals.
Identifying Downtrends through Technical Indicators
In technical analysis, a downtrend is marked by a series of lower highs and lower lows, indicating a bearish sentiment. This trend can be confirmed through various technical indicators such as downward-trending moving averages, which follow the price movements, and trendlines that connect these lower peaks. Additional chart patterns like the head and shoulders or descending triangles further substantiate the presence of a downtrend. In such scenarios, traders might consider short-selling to capitalize on the expected decrease in stock prices.
Deciphering the Role of the Flagpole in Chart Patterns
The flagpole forms an integral part of the flag pattern, characterized by a sharp and substantial price movement, often following a significant market event or news release. This sudden movement underscores the flagpole's importance, setting the stage for a possible continuation of the trend. The length and momentum of the flagpole, which can vary across different time frames, are critical for traders as they provide clues about future price actions. Following the flagpole, a consolidation phase known as the 'flag' occurs, indicating a pause in momentum. This setup often leads to a continuation of the initial trend, giving traders opportunities to plan their market entries and exits effectively.
By integrating these concepts, traders can enhance their market analysis and strategy development, aligning their actions with the observed market dynamics.
How to Identify a Bear Flag Pattern?
The bear flag pattern is a prevalent technical analysis tool that signals the continuation of a downward trend. It is characterized by a sharp decline in price, known as the flagpole, followed by a period of upward consolidation, referred to as the flag. This pattern is crucial for traders as it indicates potential selling opportunities.
Identifying the Bear Flag Pattern
To recognize a bear flag, observe the following key aspects:
- Initial Sell-off: The formation begins with a significant drop in price, accompanied by high trading volume. This initial sell-off forms the flagpole and is indicative of strong selling pressure.
- Consolidation Phase: After the sharp decline, the price stabilizes and begins to consolidate upwards in a narrower range. During this phase, trading volume typically decreases, reflecting a lack of bullish momentum and suggesting that the upward movement is temporary.
- Volume Dynamics: An increase in volume during the downward movement and a decrease during the consolidation are critical indicators of the pattern’s validity.
Criteria for a Valid Bear Flag Pattern
- The consolidation should be relatively short. Extended periods of consolidation may invalidate the bear flag pattern, leading traders to search for other bearish reversal patterns such as the hanging man, shooting star, or bearish engulfing.
- The breakout from the flag should occur downwards, with a strong movement indicated by a volume spike. This confirms the continuation of the bearish trend.
Trading the Bear Flag
When trading the bear flag, look for the completion of the consolidation phase and a breakout below the consolidation. This breakout is often validated by bearish candlestick patterns or a move below a support level. Traders might consider entering short positions following the breakout, as the price is likely to continue its decline. The downward movement post-breakout can be influenced by external factors such as negative news or weak economic data, potentially leading to accelerated price drops.
By integrating these insights into your trading strategy, you can effectively leverage the bear flag pattern to capitalize on downtrends and enhance your market positioning.
50-Period Moving Average in Bear Flag Pattern Detection
The 50-Period Moving Average (MA) is an essential tool for traders aiming to identify and confirm bear flag patterns. This moving average serves multiple roles, from confirming the trend direction to acting as a dynamic resistance level.
Roles of the 50-Period MA in Bear Flag Analysis:
- Trend Confirmation: The 50-period MA is crucial in determining the market’s intermediate-term trend. For a bear flag pattern, the price typically remains below this MA, signaling a prevailing bearish trend. This alignment between the price and the MA confirms the market's readiness for a bear flag setup.
- Dynamic Resistance: During a bear flag formation, the 50-period MA often acts as resistance. As the price undergoes a slight upward consolidation (the flag), it commonly encounters resistance at this MA. Failure to surpass the MA reinforces the bearish outlook, suggesting that the downtrend will likely persist.
- Pattern Validation and Breakout Confirmation: The integrity of the bear flag pattern is strengthened when the price consistently stays below the 50-period MA during the consolidation phase. A breakout below the flag that occurs while the price is still under this MA adds further confidence to the bearish continuation. Conversely, if the price breaks above the MA, it could indicate a weakening of bearish momentum or a potential trend reversal.
- Smoothing Price Volatility: By smoothing out short-term price fluctuations, the 50-period MA helps clarify the true trend, minimizing the risk of misinterpretation caused by transient price spikes or dips within the bear flag's consolidation phase.
Practical Application on Trading Charts:
In practical terms, when applying the 50-period MA to trading charts, such as the daily EURUSD, traders can observe the bearish trend confirmation as the price consistently stays below this MA. The inability of bulls to push the price above the 50-period MA after testing previously broken support levels further validates the bearish control. Moreover, a decrease in volume during the consolidation period typically accompanies the price staying below the MA, indicating that the market remains dominated by bears.
Trading Strategy Based on the 50-Period MA and Bear Flag Pattern:
Traders should monitor for a breakout below the flag formation with the price under the 50-period MA. This setup often presents a favorable opportunity to initiate short positions, capitalizing on the expected continuation of the downtrend. The clear identification and understanding of these elements allow traders to execute more informed and strategically sound trading decisions, aligning with the ongoing market dynamics.
Bear Flag vs. Bull Flag
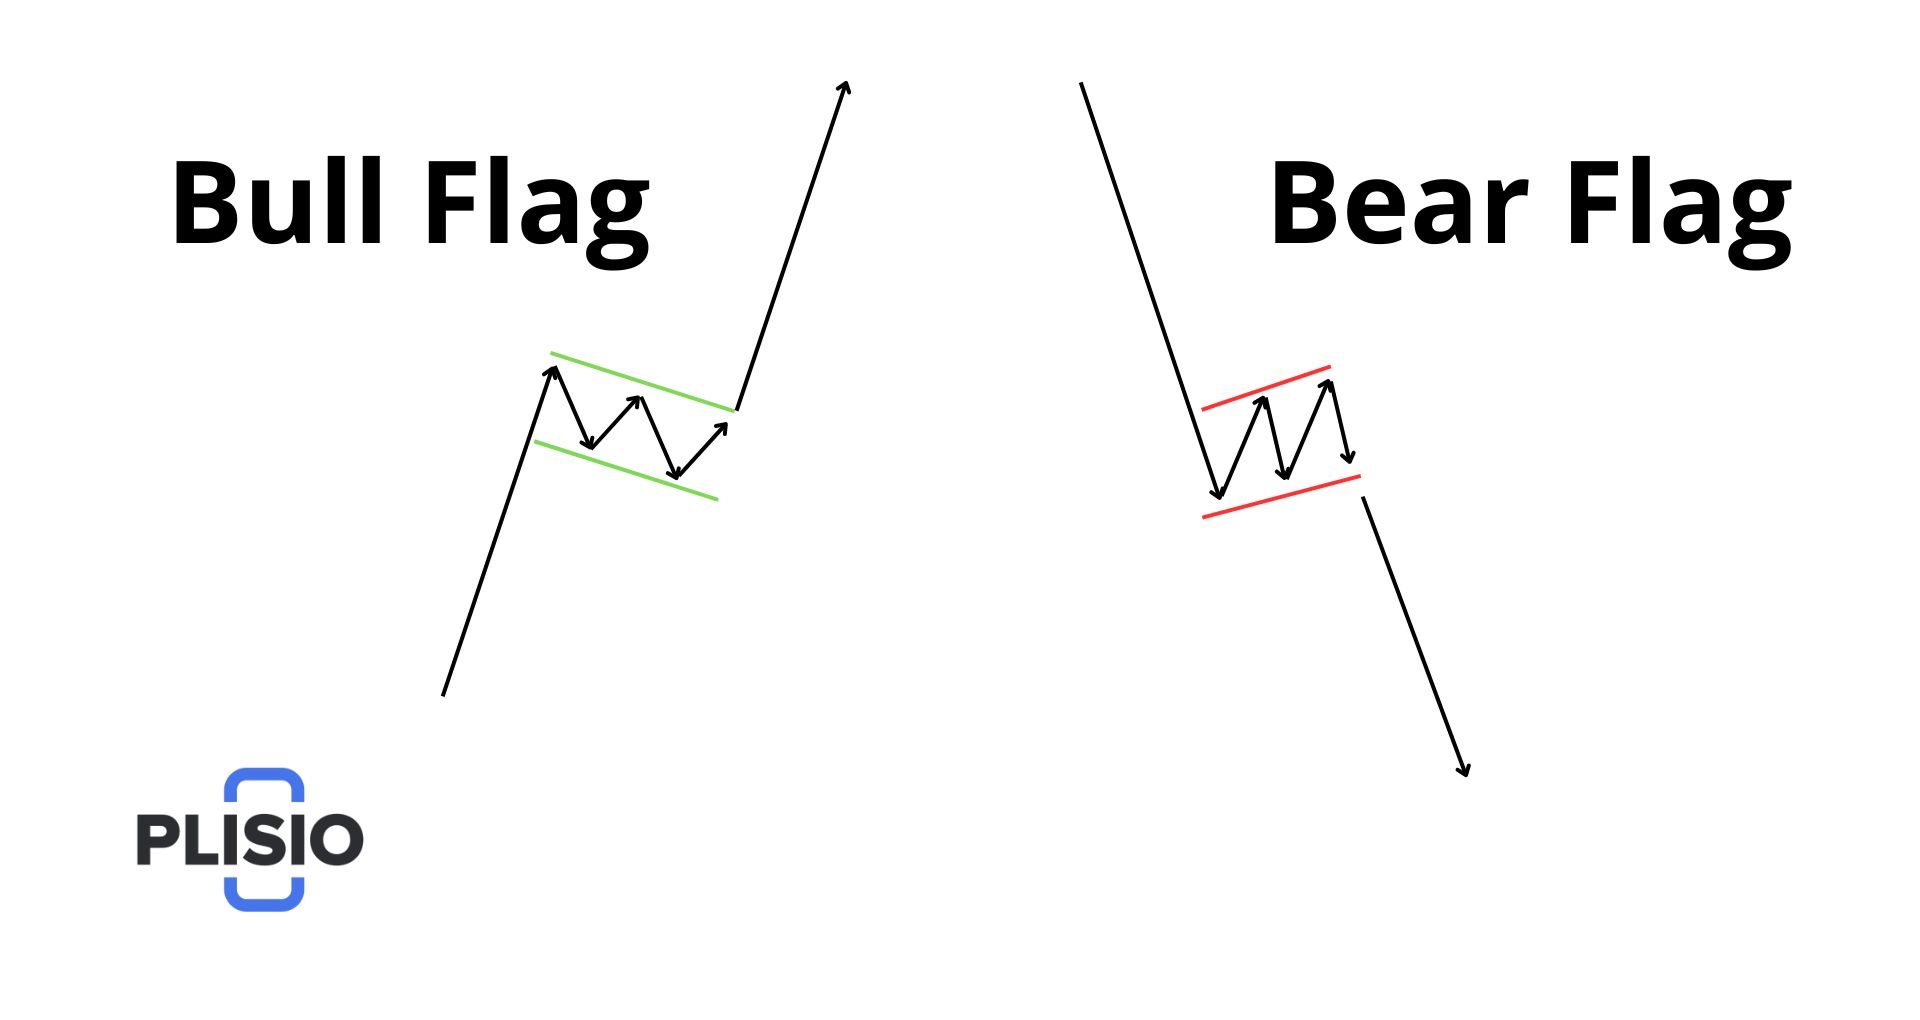
Flag patterns are essential tools in technical analysis, providing signals for both bullish and bearish market movements. Both the bull flag and bear flag patterns share a similar structure, yet they indicate opposite market trends.
Structure and Significance of Flag Patterns:
Common Structure: Whether it's a bull or bear flag, the pattern comprises support and resistance levels, a flagpole representing a significant price movement, the consolidation phase forming the flag, and the critical breakout point.
Direction of Movement:
- Bull Flag: This pattern emerges during an uptrend, signaling a potential further rise in prices. The formation begins with a sharp increase in price (flagpole), followed by a period of consolidation that moves slightly downward or sideways, resembling a flag. A breakout above the upper resistance of the flag typically precedes a continuation of the upward trend.
- Bear Flag: Conversely, a bear flag appears during a downtrend and suggests a continuation of the fall in prices. It starts with a steep decline in price (flagpole), followed by a brief consolidation that moves slightly upward or sideways. A breakout below the lower support of the flag generally leads to a continuation of the downward trend.
Practical Implications for Traders:
Understanding these patterns helps traders anticipate potential market movements and align their strategies accordingly. For instance, identifying a bull flag during an uptrend can be a signal to consider entering a long position in anticipation of a continued rise. Similarly, spotting a bear flag during a downtrend might be an indicator to initiate a short position, expecting further declines.
Bear Flag and Bear Pennant
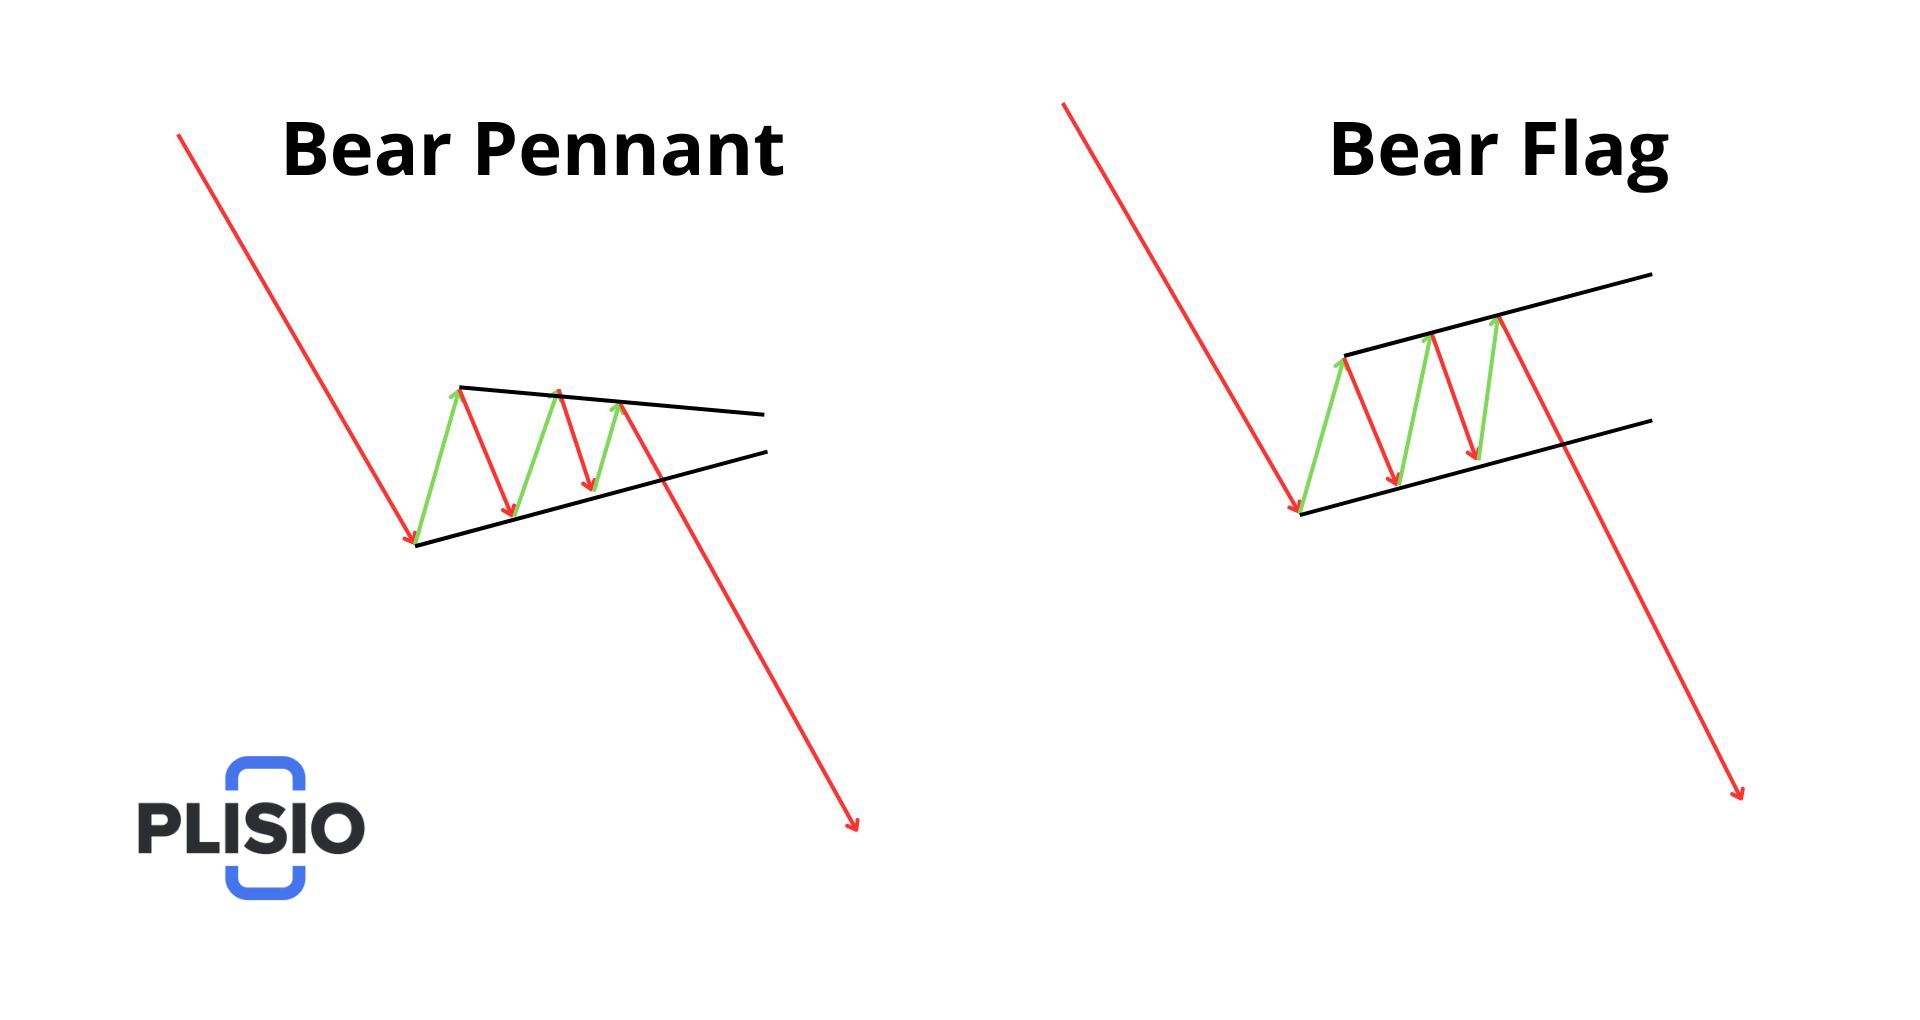
Bear flag and bear pennant patterns are crucial tools in technical analysis, specifically designed to identify potential continuations in bear markets. While both patterns signal downward trends and bearish activity, they have distinct characteristics and formations that can help traders anticipate market movements and plan their strategies accordingly.
Key Differences and Characteristics:
Bear Flag Pattern:
- This pattern typically begins with a sharp decline in price, forming what is known as the flagpole.
- Following the initial drop, there is a brief period of consolidation that tends to slope slightly upwards or moves sideways, forming the flag.
- The consolidation is usually short-lived, and a breakout below the lower boundary of the flag signals the continuation of the downtrend.
Bear Pennant Pattern:
- Similar to the bear flag, the bear pennant starts with a significant downward movement, creating the flagpole.
- However, the consolidation phase in a bear pennant is characterized by a tighter, more horizontal narrowing of price movements, resembling a small symmetrical triangle or pennant.
- This period of sideways trading indicates a pause in market momentum before the trend resumes its downward course with a breakout below the consolidation.
Practical Trading Considerations:
Both patterns are indicative of strong bearish sentiment and are commonly used by traders to prepare for entering short positions. The duration of consolidation and the pattern’s structure provide insights into market sentiment and potential price movement:
- Bear Flag: Due to its brief consolidation phase, the bear flag suggests a quicker resumption of the bearish trend, making it a favorite among traders looking for short-term opportunities.
- Bear Pennant: The extended consolidation in a bear pennant suggests a stronger buildup of bearish pressure, potentially leading to a more pronounced continuation of the downtrend once the breakout occurs.
Strategies for Trading with a Bear Flag Pattern
Trading the bear flag pattern can be a potent tool, especially in bearish market conditions. This pattern, recognizable by its sharp decline followed by a brief period of consolidation, provides clear signals for potential downtrend continuations. To capitalize on this pattern effectively, employing a robust trading strategy that combines technical analysis and prudent risk management is essential.
Strategy №1: Bear Flag Breakout Downside
The Bear Flag Breakout strategy is a powerful technical analysis tool used by traders to capitalize on continuing downtrends. This strategy involves several steps to ensure a methodical approach to trading this pattern, combining various technical indicators for a robust execution.
Step-by-Step Trading Strategy:
Identifying the Flagpole and Flag:
- Begin by detecting the flagpole, which is a sharp sell-off indicating strong bearish momentum. The formation of the flagpole is critical as it sets the stage for the ensuing bear flag pattern.
- Observe the formation of the flag, which typically consolidates upward slightly or moves sideways, forming a counter trend to the initial sharp decline.
Monitoring Technical Indicators:
- Utilize volume indicators to assess the strength of the bear trend during the flagpole formation. High volume during the sell-off and diminishing volume during the flag's formation are typical characteristics.
- Apply the Relative Strength Index (RSI) to gauge whether the asset is oversold, ideally looking for an RSI reading below 30 during the consolidation phase.
- The 50-period Simple Moving Average (SMA) can be used to confirm the bearish momentum, ensuring the price is below this level during the breakout.
Waiting for the Breakout:
- Patiently wait for the price to break below the flag’s lower boundary, signaling a continuation of the bearish trend. This breakout should ideally occur on increased volume, reinforcing the bearish momentum.
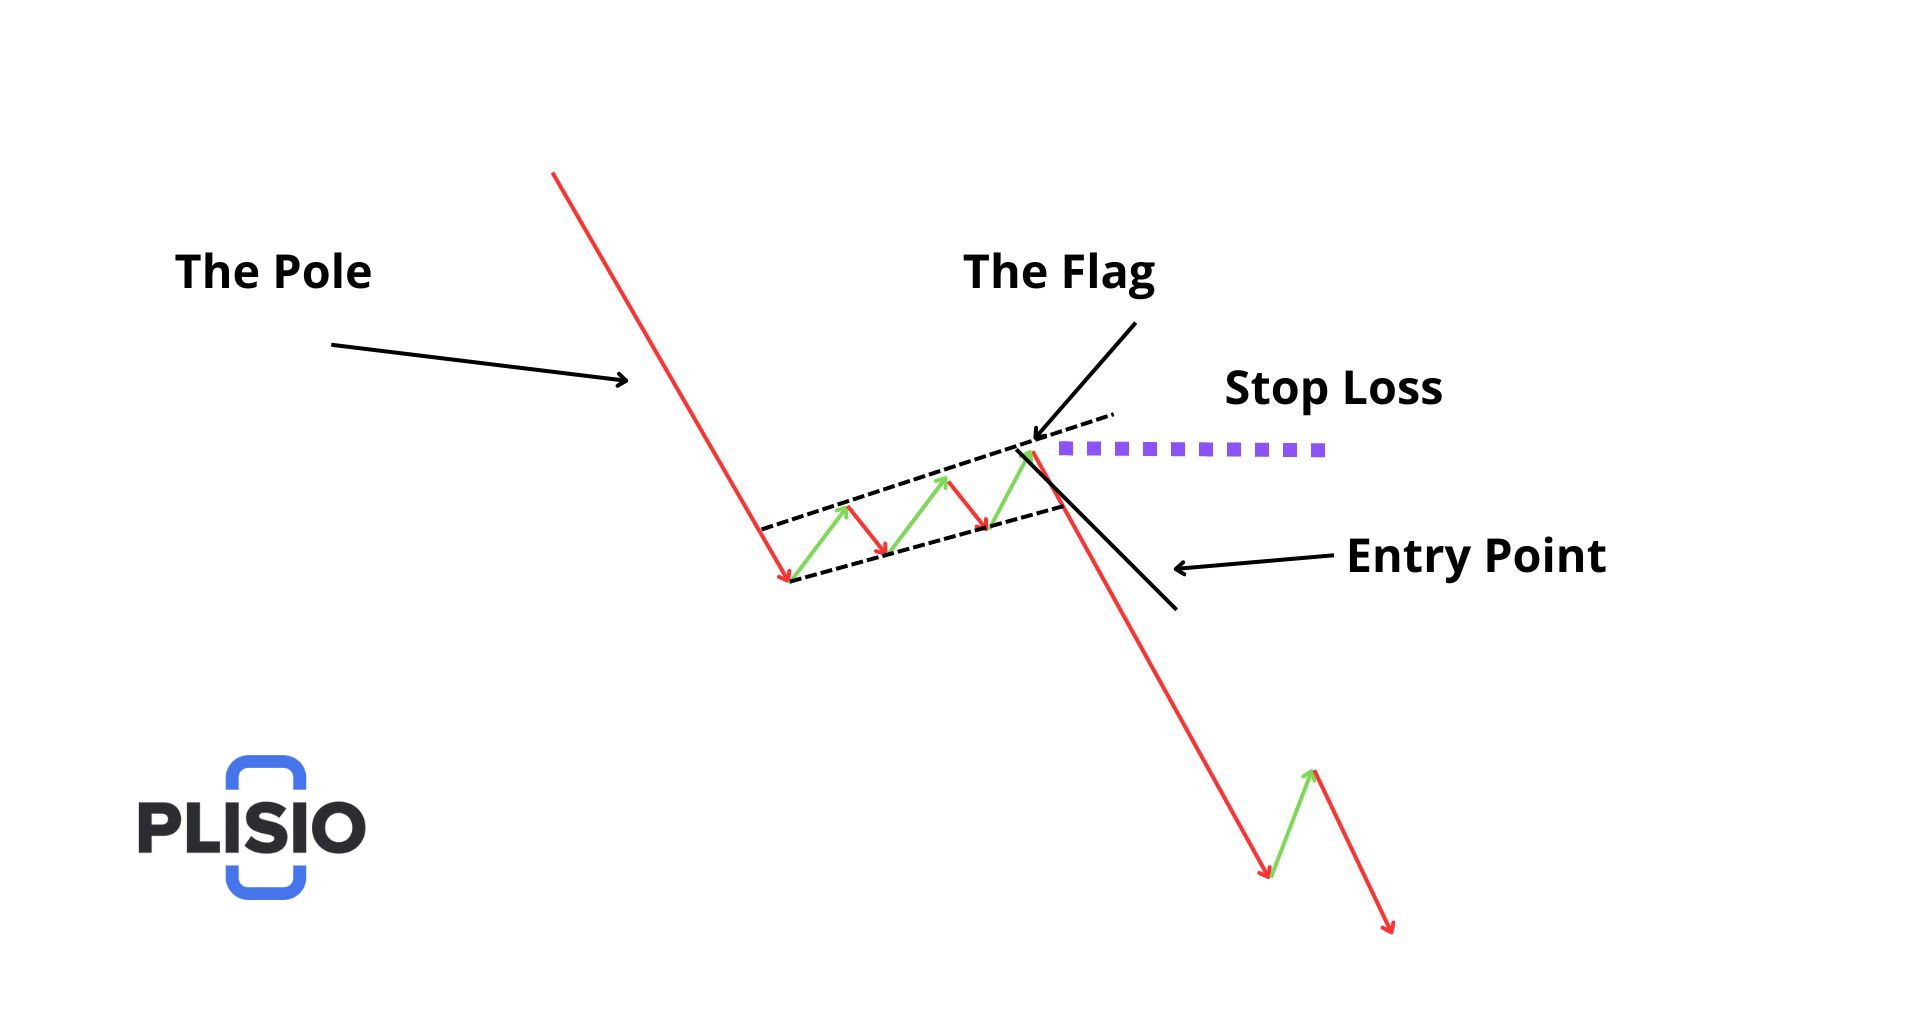
- Enter a short position immediately after the breakout is confirmed, typically on the candle that follows the one breaking through the support level of the flag’s lower border.
Setting Stop Loss and Take Profit:
- Set a stop-loss order just above the upper border of the flag to limit potential losses should the breakout reverse. This resistance level serves as an effective cutoff point for the trade.
- Determine the take profit level by measuring the distance of the flagpole and projecting this same distance downward from the point of breakout. This method aims to capitalize on the expected continuation of the price decline.
Execution and Risk Management:
- Execute the trade with precision by entering just after the breakout to maximize the potential return from the continued downtrend.
- Always incorporate risk management practices, including stop-loss orders to protect your investment from unexpected market reversals.
By following this detailed plan, traders can effectively use the Bear Flag Breakout strategy to take advantage of market conditions that favor bearish continuations. This strategy not only provides a clear entry and exit plan but also integrates critical technical indicators that support decision-making and enhance the probability of a successful trade.
Strategy №2: The Bear Flag Pattern and Fibonacci Retracements
The use of Fibonacci retracements in trading the bear flag pattern provides a strategic approach to identifying potential reversal points and optimizing entry and exit positions. By combining these tools, traders can enhance their precision in predicting market movements and managing risk effectively.
Detailed Steps for Trading the Bear Flag Pattern Using Fibonacci Retracements:
Identify the Bearish Trend and Flagpole:
- Confirm a bearish trend on the forex chart, defining clear support and resistance levels. This initial analysis sets the groundwork for applying Fibonacci levels.
- Recognize the flagpole of the bear flag, which is a sharp decline indicating the start of the pattern.
Apply Fibonacci Retracements:
- Once the initial flagpole is established, stretch the Fibonacci retracement tool from the high point at the resistance level to the low point at the previous support level.
- Monitor the price as it rebounds towards these Fibonacci levels during the consolidation phase. Traders typically focus on significant Fibonacci levels such as 38.2%, 50%, and 61.8%.
Plan Your Entry:
- Await the price to hit and potentially rebound from one of the identified Fibonacci levels. A reversal at these levels often suggests a continuation of the bearish trend.
- Enter a short position when the price rebounds from the upper trendline of the consolidation phase at one of the key Fibonacci retracement levels.
Set Stop Loss and Take Profit:
- Place a stop loss just above the pivot point of the correction for risk management. This positioning helps protect against potential upward breakouts that deviate from the bearish trend prediction.
- Set the take profit level equal to the length of the flagpole for an aggressive trading approach. For a more conservative strategy, use a grid to divide the profit target into several parts, allowing for partial profits as the price moves favorably.
Execution and Monitoring:
- Execute the trade with precision, ensuring the price action confirms the bearish reversal at the Fibonacci level.
- Continuously monitor the trade for any signs that contradict the bearish momentum, adjusting stop losses and take profits as necessary to lock in gains or minimize losses.
This strategy leverages the predictive power of Fibonacci retracements within the structure of the bear flag pattern, offering traders a sophisticated method to gauge market sentiment and make calculated moves. By adhering to these steps, traders can systematically approach their trades, enhancing the likelihood of success in bearish market conditions.
Strategy №3: The Bear Flag and Support Breakout
The Bear Flag and Support Breakout strategy is a focused approach that capitalizes on the breach of support levels within a bear flag pattern. This strategy enhances the predictability of bearish continuations and offers well-defined entry and exit points for traders.
Step-by-Step Guide to Implementing the Support Breakout Strategy:
Identify the Market Conditions:
- Begin by confirming a bearish trend on the chart. Clearly define the support and resistance levels, as these will play a critical role in strategy execution.
- Observe the formation of a bear flag near these critical support levels. The proximity to key support often suggests a stronger likelihood of a bearish continuation.
Incorporate Technical Indicators:
- Add the 50-period Simple Moving Average (SMA 50) to the chart to help affirm the bearish trend and ensure that the selling pressure remains strong. This moving average will act as a dynamic resistance, reinforcing the bear trend.
- For additional confirmation, consider using longer period moving averages like the 100 and 200 SMAs on longer timeframes, or shorter ones like 9, 12, and 20 SMAs on shorter timeframes. These tools can help to further validate the market momentum and trend stability.
Monitor for Support Level Breakout:
- Keep a close watch on the support level. A test of this level by price action is critical and should be monitored for potential breakout opportunities.
- Look for a decisive break below the support level, which signals a strong entry point for initiating a short position. This breakout is your key trading signal within this strategy.
Setting Up Trades:
- Enter a short trade once the price breaks below the support level, confirming the continuation of the downtrend.
- Set a stop loss just above the top line of the flag to limit potential losses should the market reverse unexpectedly.
- Determine the target for the trade by measuring the length of the flagpole. Set your take profit at a distance equal to this length from the breakout point, allowing for a clear and measured exit strategy.
Execution and Adjustment:
- Execute the short position with precision, ensuring that all signs point to a continued bearish trend.
- Regularly reassess the market conditions and the effectiveness of your indicators. Be prepared to adjust your stop loss and take profit settings in response to new market information or changes in volatility.
By methodically following these steps, traders can effectively harness the power of support breakouts within bear flag patterns. This strategy not only offers clear entry and exit guidelines but also integrates advanced technical analysis to increase the likelihood of successful trades in bearish market environments.
Entry Strategies for Trading
When planning your entry strategies for trading, it's crucial to identify precise moments that signal potential profitability. Here are refined techniques tailored to various trading strategies:
Breakout Downside Strategy:
Initiate a trade when the price conclusively closes below the flag’s lower boundary. This signals a strong continuation of the existing downtrend. Monitoring the closing price is essential as it provides confirmation that the market has accepted lower prices, thereby reinforcing the bearish sentiment.
Fibonacci Retracement Strategy:
Enter a position when the price demonstrates a clear reversal at a significant Fibonacci retracement level. Key levels to watch include 38.2%, 50%, and 61.8%. These points often act as pivotal areas where the market may pause and reverse, making them critical for timing your entries.
Support Breakout Strategy:
Execute a trade after the price decisively breaches a substantial support level within the flag pattern. A definitive break, especially on higher volume, indicates strong selling pressure and a likely continuation of the downward trend. This strategy benefits from waiting for a confirmed breakout to avoid false signals.
Enhancing Entry Decisions with Additional Insights:
- Incorporate real-time market data and trend analysis to bolster the accuracy of these strategies. Observing market behavior around these entry points can provide further validation.
- Utilize technical tools such as moving averages, RSI, or MACD to confirm the strength and momentum of the trend at your planned entry points.
- Always consider market context and broader economic indicators that might influence price movements, adjusting your strategy to align with current market conditions.
By employing these enhanced entry strategies, traders can increase their chances of successful engagements in the markets. Each strategy is designed to capitalize on specific market signals, providing a structured approach to entering trades with a higher probability of favorable outcomes.
Strategic Placement of Stop Losses to Manage Trading Risks
Effective risk management is crucial in trading, and one of the key tools for managing this risk is the strategic placement of stop losses. Here’s how to position your stop losses in different trading scenarios to protect your capital:
Breakout Trades:
Set your stop loss slightly above the flag's upper boundary. This placement ensures that if the breakout fails and the price reverses upwards, your position will be exited before potential losses escalate. This is particularly important as the area above the flag can often act as a resistance zone if retested.
Fibonacci-Based Trades:
Place the stop loss just above the most recent swing high within the flag pattern. This high often represents a critical resistance level. If the price rises past this point, it could indicate a failure of the bearish prediction based on the Fibonacci retracement, warranting an exit from the trade.
Support Breakout Trades:
Set the stop loss just above the broken support level, which may now serve as resistance. This method capitalizes on the principle that once support is broken, it often transforms into resistance. Placing a stop loss above this level can help safeguard against the price bouncing back to test and potentially break through this new resistance.
Enhancing Stop Loss Strategy with Current Market Conditions:
- Adjust your stop loss settings based on current volatility and liquidity conditions. In more volatile markets, wider stop losses might be necessary to avoid being prematurely stopped out due to market noise.
- Use additional technical indicators like the Average True Range (ATR) to gauge market volatility and set stop losses that align with current market dynamics, ensuring that they are neither too tight nor excessively loose.
- Regularly review and adjust your stop loss positions in response to ongoing market movements or as your trade progresses towards its target. This dynamic approach can help lock in profits while still protecting against sudden market reversals.
By applying these stop loss strategies, traders can effectively manage their exposure to risk across various trading setups, ensuring that they maintain control over potential losses and improve their overall trading resilience.
Setting Profit Targets in Bear Flag Trading
Setting precise profit targets is crucial for capitalizing on bear flag trading patterns, ensuring that you realize gains in alignment with the underlying market dynamics. Here’s how to determine effective profit targets based on the characteristics of the bear flag pattern:
Calculate Based on the Flagpole:
Measure the length of the initial flagpole, which signifies the prior sharp price movement. Project this distance downward from the breakout point of the flag’s lower boundary. This projection gives a quantifiable target that mirrors the pattern’s previous momentum, providing a realistic estimate of potential price movement.
Incorporate Support Levels:
For those preferring a more conservative strategy, setting profit targets at established support levels below the entry point can be advantageous. These levels often act as natural points where the price might stall or reverse, making them practical targets for capturing profits before potential pullbacks.
Enhancements for Profit Target Strategies:
- Adjust your profit targets based on live market data and emerging trends. As markets evolve, so should your strategies. Be ready to modify your targets to fit changing market conditions.
- Consider the broader market context, such as economic indicators or significant geopolitical events, which could influence price movements and affect the validity of your projected targets.
- Use trailing stops to maximize potential profits while minimizing risks. This approach allows you to keep the trade open as long as the price moves favorably but locks in gains if the market begins to turn against your position.
Comprehensive Approach to Trading Bear Flags:
Trading bear flags effectively requires not only recognizing the pattern but also executing trades with strategic precision. Whether employing breakout signals, Fibonacci retracements, or support level strategies, the integration of well-planned entry points, meticulous stop loss placement, and calculated profit targets is essential for successful trading in bearish market conditions.
By adhering to these guidelines, traders can enhance their ability to not only identify profitable opportunities but also to manage their trades to optimize returns while controlling risk in dynamic market environments.
Is Bear Flag a Reliable Indicator?
The bear flag pattern is often considered a dependable indicator for anticipating the continuation of bearish trends. However, its effectiveness is primarily in the context of existing downtrends. This necessitates traders to verify bearish signals prior to initiating trades to ensure alignment with broader market movements.
Key Considerations for Using Bear Flag Patterns Effectively:
Contextual Use:
The bear flag is most effective when applied within a confirmed downtrend. Recognizing the overarching market direction before using the bear flag pattern helps in aligning your trading strategy with prevailing market conditions.
Risk Management:
Always set a stop loss just above a resistance level when trading with a bear flag pattern. This placement helps mitigate potential losses if the market moves contrary to your expectations, providing a safety net for your capital.
Confirmation with Other Indicators:
To enhance the reliability of a bear flag pattern, it’s advisable to use additional technical indicators. The Relative Strength Index (RSI), for example, can be particularly useful. An RSI reading below 30 might indicate an oversold condition, thus corroborating the bearish momentum suggested by a bear flag pattern.
Enhanced Strategy for Improved Outcomes:
- Integrate the bear flag pattern with other technical analysis tools such as moving averages, MACD, or candlestick patterns for more robust trading decisions. This multi-indicator approach can help confirm the strength and sustainability of the bearish trend, increasing the probability of successful trades.
- Stay informed about market news and economic events that could impact price movements, as these can often preempt or invalidate pattern predictions.
By adopting these strategies, traders can leverage the bear flag pattern more effectively, maximizing its utility as a predictor of bearish trends while safeguarding investments against adverse market shifts. This holistic approach to trading ensures that decisions are not only based on technical patterns but are also supported by a comprehensive analysis of market conditions and risk management practices.
Pros and Cons of the Bear Flag Pattern
The bear flag pattern is a staple in technical analysis, offering clear signals for the continuation of a bearish trend. Despite its reliability, like all trading tools, it has its advantages and disadvantages.
Pros of the Bear Flag Pattern:
- Reliability in Trend Prediction: The bear flag is known for its effectiveness in signaling the continuation of downtrends, making it a reliable tool for traders looking to capitalize on these movements.
- Profitable Short Trading Opportunities: This pattern allows traders to enter short trades with a good understanding of potential downtrends, which can lead to significant profits.
- Versatility Across Markets: The bear flag pattern is not limited to a specific market; it is applicable in cryptocurrency, forex, stocks, futures, and commodities.
- Utility in Various Timeframes: It proves effective in different trading timeframes, particularly in intraday trading where it helps to capture quick moves.
- Defined Entry and Exit Points: The pattern provides clear rules for where to enter and exit trades, helping to minimize risks and manage trades more effectively.
- Frequent Occurrence: The pattern is common, which provides frequent opportunities for traders to utilize it.
- Favorable Risk/Reward Ratio: When identified correctly, the bear flag pattern offers a strong potential upside relative to the risk undertaken.
Cons of the Bear Flag Pattern:
- Potential for Unreliability: While generally reliable, the bear flag can fail, particularly if not confirmed with other indicators.
- Limited Upside for Risk-Averse Investors: For those who prefer to avoid risky trades, the potentially aggressive nature of the bear flag pattern may not align with their more conservative trading strategies.
- Complexity in Identification: New traders might find it challenging to accurately identify and interpret this pattern. It requires an understanding of several factors including volume, candlestick patterns, and additional technical indicators for confirmation.
- Risk of Misinterpretation: Incorrectly defining the bear flag pattern can lead to misjudging its implications—seeing a full reversal instead of a correction if the flag correction exceeds 30% of the flagpole.
- Market Conditions: The effectiveness of the bear flag pattern can be contingent on market conditions. It performs best in clear downtrends; its reliability diminishes in volatile or sideways markets.
Failed Bear Flag in Trading
A failed bear flag represents a significant deviation from the expected outcome of a bear flag pattern, marking a reversal from a bearish to a bullish trend. Recognizing a failed bear flag is crucial for traders as it helps mitigate risks and adjust strategies in response to unexpected market movements. Here’s how to identify a failed bear flag on a price chart:
Key Characteristics of a Failed Bear Flag:
Stable Support Level:
In a typical bear flag, the price breaks below the flag’s lower support to confirm a continuation of the bearish trend. In a failed bear flag, however, the price maintains or bounces off this critical support level, suggesting a potential shift in market sentiment toward bullishness.
Moderate Volume Fluctuations:
Unlike the sharp volume decline expected in a successful bear flag, a failed bear flag shows only modest decreases in volume. This indicates a lack of strong bearish momentum, calling into question the reliability of the bearish continuation.
Bullish Breakout:
Contrary to the downward breakout anticipated in bear flag formations, a failed bear flag sees the price breaking above the pattern’s upper resistance. This upward movement is a clear signal of a bullish reversal, contradicting the initial bearish expectations.
Volume Increase on Retests:
A significant indicator of a strengthening bullish trend in the context of a failed bear flag is an increase in volume when previous price levels are retested. This behavior supports the reversal and suggests growing buyer interest and market strength.
Strategic Implications for Traders:
Recognizing the signs of a failed bear flag not only prevents potential losses but also opens up opportunities for traders to capitalize on emerging bullish trends. By adapting to the new market direction, traders can position themselves advantageously, whether it’s through seizing new long positions or exiting existing short positions.
Concluding Insights on the Bear Flag Pattern in Trading
The bear flag pattern is renowned within the realm of technical analysis as a pivotal indicator of trend continuation, particularly in bearish markets. Its frequent occurrence across various financial markets—from cryptocurrencies to stocks—underscores its significance and reliability for traders aiming to capitalize on downward movements.
Key Takeaways:
Utility and Popularity: The bear flag pattern is highly valued for its ability to predict the continuation of a bearish trend. It is one of the most popular price action patterns due to its clear formation and actionable signals.
Need for Comprehensive Analysis: Despite its advantages, the bear flag pattern should not be used in isolation. Effective trading strategies require the integration of multiple technical tools to confirm any signals derived from this pattern. This layered approach helps enhance the accuracy of predictions and minimizes risks associated with potential false signals.
Awareness of Market Volatility: Particularly in the cryptocurrency market, traders must be vigilant about the inherent volatility and unpredictability. A prudent approach involves being constantly aware of market dynamics, avoiding the pitfalls of fear of missing out (FOMO), and always conducting thorough research (DYOR—Do Your Own Research) before making trading decisions.
Importance of Experience: Successfully leveraging the bear flag pattern requires some level of experience in technical analysis. New traders should take time to educate themselves on various indicators and how they can be synergistically used to improve trading outcomes.
Final Advice:
In conclusion, while the bear flag pattern is a powerful tool for traders, its effectiveness is significantly enhanced when used alongside other analytical methods and market indicators. Traders should also maintain a disciplined approach to risk management, especially in highly volatile markets, to safeguard their investments. As always, continual learning and adaptation to the evolving market conditions are crucial for sustaining success in trading
