Truflation: Real-Time Inflation Data, Is It Reliable?

The official inflation figure and a blockchain index updated every single day no longer tell the same story. In early 2026 the Bureau of Labor Statistics reported US consumer prices rising close to 3% a year. Truflation, an on-chain index that recalculates daily, was reading roughly a full percentage point lower. Traders started watching both. So which one is right, and why would anyone trust a number that lives on a blockchain over the Consumer Price Index the government has published since 1921? This article explains what Truflation is, how it measures prices, how it compares with the official CPI, what the TRUF token actually does, and whether the daily figure deserves a place in how you think about inflation.
What Truflation Is and Why It Exists
Truflation is not "crypto inflation." It is a decentralized economic data provider that publishes a daily United States inflation index and delivers it on-chain. Where the CPI arrives once a month and looks backward, Truflation aims to show where prices are right now.
It exists for a simple reason: the official measure is slow, and trust in it has thinned. The CPI itself dates back to 1921, and while the methodology behind it has been refined many times, its basic rhythm has not changed: collect prices, survey households, publish once a month. People who do their own shopping often feel the published rate understates what they pay, and the lag between a price moving in the real economy and that move showing up in a government release can stretch to weeks. Truflation's bet is that a transparent, real-time index built from live prices is more useful for decisions than a survey-driven number released after the fact. The Federal Reserve targets 2% inflation; both households and policymakers have an obvious interest in knowing, sooner rather than later, when reality is drifting away from that goal.
The project launched in December 2021. Its founder, Stefan Rust, previously ran Bitcoin.com, and the early version won a $200,000 prize in a Coinbase-backed challenge. From the start the design leaned on blockchain oracles to push the index out where smart contracts and applications can read it directly.
How Truflation Measures Inflation Daily
The method is the whole story here. Strip away the on-chain packaging and Truflation is an attempt to measure prices directly, at scale, refreshed every day rather than sampled and surveyed once a month.
Thirty million prices, not eighty thousand
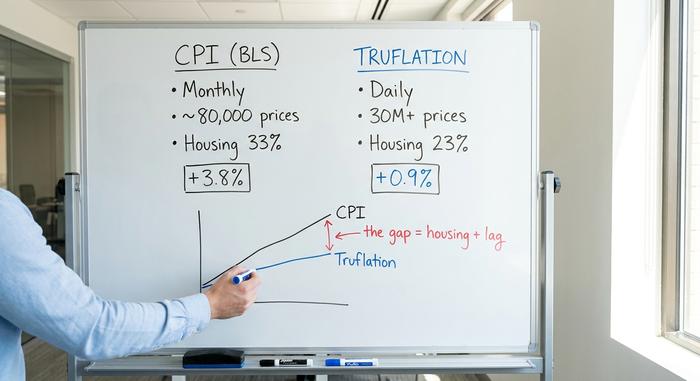
The headline difference is raw coverage. Truflation says it aggregates more than 30 million price points each day from over 80 data sources, according to its published methodology. The BLS, by comparison, builds the CPI from roughly 80,000 price observations collected by field staff and surveys each month. More data is not automatically better data, but it does change what kind of errors are likely: a daily index reacts fast and can be noisy, while a monthly survey is smoother and slower.
Twelve categories and the housing question
Truflation mirrors the CPI's structure, sorting spending into twelve consumption categories so the two can be compared category by category. The gap shows up most in housing. Truflation weights housing at about 23%, while shelter makes up closer to a third of the official basket. It also tracks live rents from sources like Zillow rather than the owner's-equivalent-rent method the BLS uses, which imputes a notional rent for homeowners and tends to lag the real market by many months. That single choice explains a large share of why the two indexes drift apart.
Daily updates instead of a monthly lag
The official CPI is published monthly, weeks after the period it covers. Truflation updates daily, which is the entire pitch. Category weights are now rebalanced once a year to reflect how household spending and expenditure patterns shift. That annual cadence is itself a change worth noting, because the rebalancing schedule turns out to sit at the center of the main criticism of the index, which I will come back to.
The delivery is the part that makes this a blockchain project rather than just another data vendor. Raw prices flow in from each provider through software adapters, get aggregated and validated, and are then written on-chain so any application can read the same figure without trusting a private feed. Truflation publishes the index across multiple networks using oracle infrastructure, which means the number is auditable: you can check the source on-chain rather than taking a press release on faith. That transparency is the design choice that separates it from a government statistic, where the inputs stay behind closed doors.
Truflation vs the Official CPI: the Real Gap
The divergence between the two numbers is not random wobble. It is mostly structural — and once you see where it comes from, the gap becomes informative rather than embarrassing for either side.
Why the two numbers diverge
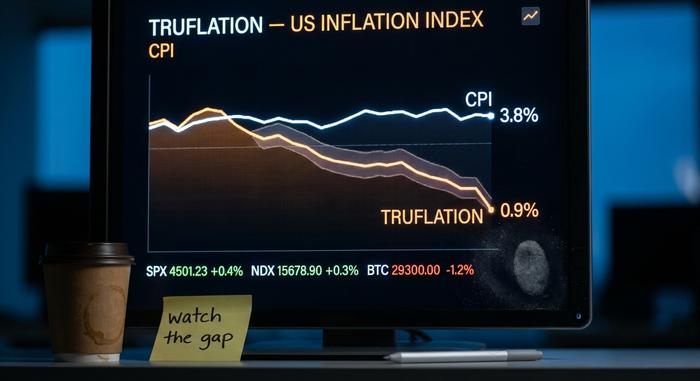
The readings have parted ways repeatedly. In July 2025 the BLS put headline CPI at 2.7% year over year, with core CPI at 3.1%; Truflation's index was reading near 2.02% that autumn. By April 2026 the gap had widened the other way around the edges, with the official BLS CPI accelerating toward 3.8% while Truflation sat closer to 0.9%. Housing is the main lever. Because shelter carries a heavier weight in the CPI and is measured with a lagged method, the official index kept reporting elevated shelter costs long after live rents had cooled. Truflation, reading current rents, moved sooner.
A leading indicator, with caveats
This is where Truflation earns its keep. Across the full history, its index has tracked turning points in the CPI roughly 41 to 45 days early, with a correlation around 0.96 to the official series, per Truflation's own analysis. That is a useful property: a forward-looking metric that points where the slower official measure is heading. The proving moment came during the 2022 price spike, when US inflation pushed above 9% and the eurozone topped 11%; a daily gauge that could flag the surge as it built, rather than a month later, suddenly had an obvious audience among traders and economic desks. The caveat is that the relationship is not stable across regimes. During the post-2023 disinflation, the correlation reportedly fell to about 0.71, and that was exactly the stretch when Truflation's low readings drew the most attention and the most doubt. A leading indicator that leads beautifully in one cycle and wobbles in the next is still worth having, as long as you remember which kind of period you are in.
| Feature | Official CPI (BLS) | Truflation |
|---|---|---|
| Update frequency | Monthly | Daily |
| Price observations | ~80,000 sampled | 30M+ aggregated |
| Data type | Field collection and surveys | Live market prices, 80+ sources |
| Housing weight | ~33% of basket | ~23% of basket |
| Shelter method | Owner's-equivalent rent (lagged) | Live rents (e.g. Zillow) |
| Publication lag | Weeks after month-end | Real-time |
| Oversight | Government statistical agency | Decentralized, on-chain |
Who Uses Truflation Data: API Access and Markets
Adoption is the real credibility test, and on the data side it is quietly happening even while the token sits in the gutter. The clearest signal came when Truflation's US Inflation and PCE indexes went live on the Bloomberg Terminal in late 2025, putting a blockchain-sourced number on the same screens institutional desks already use for everything else.
The index is also available across several chains, including Ethereum, Solana, Base, and Arbitrum, so applications can pull it without leaving their own ecosystem. DeFi projects such as Nuon, Index.fun, and QuantAMM have wired Truflation data into their products, and the broader market reach goes back further: CNN reported in 2024 that traders and economists were already using the real-time gauge to get ahead of official releases. Most of this runs through paid API access and a data marketplace, which is where the protocol earns money and where the case for it being a real economic data business, not just a crypto experiment, actually rests.
The Bloomberg listing matters more than the chain integrations, and it is worth being clear about why. A terminal subscription is the default tool of professional financial analysis, and getting an index onto it is a slow, gatekept process that does not happen on hype. When a blockchain-sourced inflation figure shows up next to the official series on those screens, it stops being a curiosity and becomes one more input a serious analyst can weigh. That is the kind of quiet institutional validation that is far harder to win than a flashy partnership announcement, and it is the strongest single piece of evidence that the data product has outgrown its origins.
TRUF Tokenomics, Supply and Token Pricing
Here is where you have to separate the protocol from the token — because their fortunes have sharply split. Truflation's data product is being adopted; the TRUF token has collapsed.
TRUF is an ERC-20 token with a maximum supply of one billion. The distribution allocates 60% to ecosystem growth released over eight years, 25% to investors, 13% to the team, and 2% to advisors on a two-year vesting schedule. Its utility is threefold: paying for data access, voting in governance, and staking to help secure the network. The project raised about $6 million in a February 2024 round backed by names including Laser Digital and Chainlink, then held its token generation event that April at an initial price near $0.075.
The market has not been kind since. The token reached an all-time high of about $0.91 in April 2024 and has bled out almost entirely since, CoinGecko data shows. As of June 2026 TRUF traded around $0.0044 with a market cap near $2.3 million, roughly 99.5% below that peak. The uncomfortable lesson is that a token can carry real technology and still trade like an afterthought.
| TRUF token | Detail |
|---|---|
| Standard | ERC-20 |
| Max supply | 1,000,000,000 TRUF |
| Ecosystem allocation | 60% (8-year release) |
| Investors | 25% |
| Team | 13% |
| Advisors | 2% (2-year vesting) |
| Funding round | ~$6M (Feb 2024) |
| All-time high | ~$0.91 (Apr 2024) |
| Price / market cap (Jun 2026) | ~$0.0044 / ~$2.3M |
Is Truflation Reliable? The Skeptics' Case
So can you trust the number? My honest answer is that Truflation is a fast, transparent second opinion on inflation measurement, not a replacement for the CPI and not something to quote as settled truth.
The methodology critiques
The most pointed criticism came from the economist Lars Christensen, writing as the Market Monetarist in February 2025. He argued that Truflation's practice of adjusting category weights on a fixed schedule produced visible jumps at the start of certain months, jumps that looked like methodological artifacts rather than real price moves. Economists on forums like r/AskEconomics have pressed a harder, older question: quality adjustment. When a car gets more expensive because buyers choose leather seats over cloth, how much of that is inflation and how much is a better product? When a streaming subscription replaces the old video store, what exactly is being measured? These are the unglamorous problems national statistics agencies have spent decades wrestling with, and a scraped-price index does not automatically solve them. Direct prices are not the same as correctly measured prices.
What it actually gets right
Set against that, Truflation's strengths are real. It is fast, its inputs are auditable, it is hard to quietly manipulate, and it has repeatedly flagged both cooling and re-acceleration before the BLS confirmed them. That early-warning record is the strongest argument in its favor. Where I land is straightforward: treat Truflation as a directional, leading gauge of where inflation is heading, and lean on its transparency. Just do not mistake a single daily reading for the final word on the cost of living.
Truflation as a Signal, Not Gospel
Truflation is best understood as a daily, on-chain second opinion on inflation, worth watching precisely because it is built and weighted differently from the official measure. The structural gap with the CPI, driven mostly by housing and timing, is a feature that tells you something about the limits of both indexes, not proof that one side is lying. The TRUF token is a separate matter entirely, and a far riskier one than the data it represents. The open question is the one worth sitting with: if a transparent index keeps spotting turns weeks before the official number, how long can the slower measure stay the one that moves markets and policy?