GDP Meaning: What Gross Domestic Product Says About the Economy
Put every cryptocurrency on Earth into one pile and it is worth roughly what Spain's economy produces in a single year. That comparison tells you almost nothing about blockchains and almost everything about scale — and scale is exactly what gross domestic product measures. GDP is the headline number that quietly decides what your money does next: whether central banks cut rates, whether the dollar firms up, whether risk assets like Bitcoin catch a bid or get sold off. Most people meet GDP only as a one-line news flash and scroll past. That is a mistake. The GDP meaning behind the headline, what it counts, what it ignores, and why markets flinch when it surprises, is one of the few macro skills that pays off even if you only ever touch crypto.
The definition of GDP, and what it leaves out
The definition is the easy part. The omissions are where the number starts to mislead, and that gap is the whole reason GDP and markets sometimes disagree.
The plain definition
Gross domestic product is the total monetary value of all final goods and services produced within a country over a set period, usually a quarter or a year. Three words carry the weight. Final means the last sale counts, not the parts along the way: a loaf of bread is in GDP, but the flour the baker bought is not counted separately, because its value already sits inside the bread. This is how national accounts avoid double counting. Within a country's borders means it does not matter who owns the factory, only where the output happens. And it is a flow, not a stash. GDP measures what an economy produced this year, not the wealth it has piled up over centuries.
What GDP leaves out
A lot of real economic activity never shows up, because GDP counts only economic activities that pass through a market with a price tag. Unpaid household labor, raising children, cooking dinner, caring for a parent, produces enormous value and counts for zero. So does volunteer work and most of the informal cash economy. Financial transactions and resales of used goods are excluded too, because reselling a used car is not new production. The car was already counted once, when it was built. Add it all up and a large share of what genuinely sustains people, the care, the community, the unpriced work that holds a household together, lives entirely outside the number.
Why the blind spots matter
GDP says nothing about who gets the income, what the production did to the air and water, or whether people are actually better off. Two countries can post the same GDP while one shares it broadly and the other funnels it to a tiny elite — the number cannot tell them apart. Worse, destruction can read as growth. A hurricane that flattens a city can lift GDP, because rebuilding is new output, while a long, cheap, healthy life barely registers at all. Simon Kuznets, the economist who built the first US accounts, warned Congress himself in 1934 that "the welfare of a nation can scarcely be inferred from a measurement of national income." That caution is in the founding document. We ignored it anyway.
How GDP is calculated: three roads to one number
There are three ways of calculating GDP, and in a perfect world all three land on the same figure. They look at the same economy from different doors.
The expenditure approach
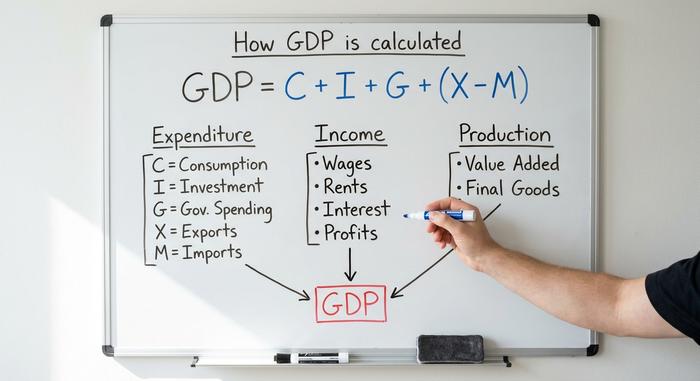
This is the one investors actually watch. It adds up everything spent: consumer spending plus business investment plus government spending plus net exports, written as C + I + G + (X − M). Consumer spending dominates. In the United States it ran at about 69% of GDP in early 2026, which makes the American shopper the single biggest swing factor in the world's largest economy. Nearly everything a household buys, from rent to coffee, contributes to GDP through this one channel. Net exports can be negative, in which case you subtract: a country that imports more than it exports trims its own GDP through that term. Business investment, the I in the formula, is the piece economists read for the future — new factories, equipment, and housing. When investment dries up, it usually warns of a slowdown before consumers feel anything.
The income approach
Flip the economy over and measure GDP the same way as income rather than spending. Add up wages (what the accounts call compensation of employees), business profits and gross operating surplus, rents, and taxes less subsidies. The logic is simple: every dollar someone spends is a dollar someone else earns, so total income should equal total expenditure.
The production approach
The third road calculates GDP by summing the value added at every stage of production, from raw material to finished product, which strips out the double counting automatically. This is the backbone of the international System of National Accounts that most statistical agencies follow.
| Approach | What it adds up | Watched by |
|---|---|---|
| Expenditure | C + I + G + (X − M) | Markets, traders |
| Income | Wages + profits + rents + taxes | Tax and labor analysts |
| Production | Value added at each stage | Statisticians, the SNA standard |
In practice the three never match to the dollar. The small gap, politely named the statistical discrepancy, is a reminder that GDP is an estimate, not a law of physics.
Nominal vs real GDP and the GDP deflator
Here is the difference between looking richer and being richer. Nominal GDP measures output at current prices. Real GDP strips inflation out by valuing everything against a fixed base year. The gap between them is rising prices.
The latest US print shows it cleanly. According to the Bureau of Economic Analysis, in the first quarter of 2026 nominal GDP grew at a 5.8% annualized rate to a level of about $31.87 trillion, while real GDP grew just 2.1%. Almost two-thirds of that headline "growth" was simply prices going up. That is why economists and news anchors quote real GDP when they talk about growth, and why a fat nominal number can hide a weak economy.
The bridge between the two is the deflator: nominal divided by real, times 100. BEA's modern releases foreground the gross domestic purchases price index, up 3.6% in that quarter, as the practical deflator.
| Measure | What it captures | Adjusts for inflation? |
|---|---|---|
| Nominal GDP | Output at today's prices | No |
| Real GDP | Output at base-year prices | Yes |
| GDP deflator | Ratio of the two | It is the inflation measure |
GDP per capita and the standard of living
Dividing total output by the number of people gets you closer to "how is life actually lived here." GDP per capita in the United States was around $85,810 in 2024, according to World Bank data, against a world average of roughly $13,664. The typical American sits inside an economy producing more than six times the global per-person figure.
But an average is not a median. GDP per capita can rise while most households feel nothing, because a handful of very rich people and a few booming industries pull the mean upward. Economists also adjust for purchasing power parity when comparing countries, since a dollar buys more in Manila than in Manhattan. Two economies can even share an identical GDP per capita while one offers cheap healthcare and long holidays and the other offers neither. The metric is useful for comparing GDP and economic performance across borders. It is a blunt instrument for judging anyone's standard of living.
GDP vs GNP and gross national income
GDP asks where output is produced. Gross national product, and its close cousin gross national income, ask who produces it. GDP counts everything made within a country's borders, whoever owns it. Gross national income counts what a country's own people and companies earn, wherever in the world they earn it.
Usually the two sit close together. They split apart in economies stuffed with foreign firms or large expat workforces. Ireland is the textbook case: multinationals book vast profits there for tax reasons, so Irish GDP looks enormous — while gross national income, which subtracts the money flowing back out to foreign owners, tells a soberer story about how much the country actually keeps.
How GDP data moves markets, including crypto
This is the part no GDP explainer seems to write, and it is the part a crypto holder should care about most. The release itself rarely matters. What repositions the dollar, bonds, and Bitcoin in the next sixty seconds is the surprise.
The surprise, not the number
Markets price the consensus forecast in advance. By the time the report drops, a 2.1% reading that everyone penciled in does close to nothing. The same 2.1% when the street expected 1.5% can shake every asset class, because traders have to reprice growth in real time. Revisions add a second layer: that Q1 2026 real figure was itself revised up from an earlier 1.6% estimate, and revisions can move markets as much as the first print.
Why strong growth can sink risk assets
It sounds backward, but good economic news can be bad market news. A hot GDP report tells the Federal Reserve it has less reason to cut interest rates. Higher-for-longer rates drain liquidity from the riskiest, most speculative corners of the market. The Fed's job, balancing employment against inflation, is the reaction function traders are really forecasting. GDP is one of its biggest inputs.
Where Bitcoin fits
Bitcoin used to be sold as an asset that floated free of all this. It no longer trades that way. Kaiko Research described it in 2026 as a "high-beta" macro asset, with its correlation to equities elevated and its sensitivity to rate expectations rising since spot ETFs went mainstream. The chain runs GDP into rate expectations, rate expectations into liquidity, and liquidity into crypto prices. A "boring" macro print is now a crypto input, and it arrives on a schedule: GDP comes in three passes each quarter, advance, second, and third, roughly a month apart at 8:30 a.m. Eastern, three separate chances to surprise.

Crypto market cap vs country GDP rankings
Stacking a borderless asset class against a country's yearly output is the cleanest way to feel both how big crypto got and how small it still is. As of June 30, 2026, the entire crypto market was worth about $2.12 trillion, according to CoinGecko. That is roughly Spain's annual GDP, a notch above South Korea. Bitcoin on its own, near $1.18 trillion, sits a tier below.
| Entity (as of 2025–26) | Value | Scale check |
|---|---|---|
| Total crypto market cap | ~$2.12T | ≈ Spain's annual GDP |
| Bitcoin market cap | ~$1.18T | Below South Korea (~$1.86T) |
| Spain GDP (2025) | ~$1.89T | The comparator |
| United States GDP | ~$31.87T | Crypto is under 7% of it |
| China GDP (2025) | ~$19.4T | Crypto is roughly a ninth |
One honest caveat, because the comparison is apples to oranges. Market cap is a stock: a snapshot of accumulated price at a single instant. GDP is a flow: new output produced over a whole year. They are not the same unit, and anyone who treats "crypto is bigger than Spain" as a literal equivalence is selling something. The numbers are good for intuition about scale. They are not an economic ranking.
A short history of GDP, from crisis to standard
GDP is younger than the automobile. Simon Kuznets built the first US national accounts in a 1934 report to the Senate, in the pit of the Great Depression, so policymakers could finally see how far output had collapsed. The 1944 Bretton Woods conference then made GDP the global yardstick for the size of an economy, comparing one country against another. It was engineered for crisis management and wartime planning, not for measuring whether daily life is any good. Which is precisely why Kuznets' welfare warning, written into the very first report, never stopped being relevant.
What the number is really telling you
You do not need to forecast GDP. The smartest way to use GDP is not as a crystal ball but as a calendar: you need to know which release is coming, when it lands, and whether it beat what the market already expected, because that gap is the part that touches your portfolio, crypto very much included. GDP is not a verdict on whether life is good. It is a flow meter for output, with real blind spots built into its design. Read it that way and the next quarterly print stops being background noise and starts being a signal. So before you brace for a move on a GDP headline, ask one question: did the number actually surprise anyone? If it did not, the reaction you are waiting for probably already happened.


