What Is a Bear Flag Pattern and How to Trade It
Sit with a falling crypto chart for a while and this one keeps showing up. Price drops, pauses, then eases upward in a neat little sloping channel. That is a bear flag pattern. It catches people out because the bounce reads like a bottom when it is really just a pause before the next drop.
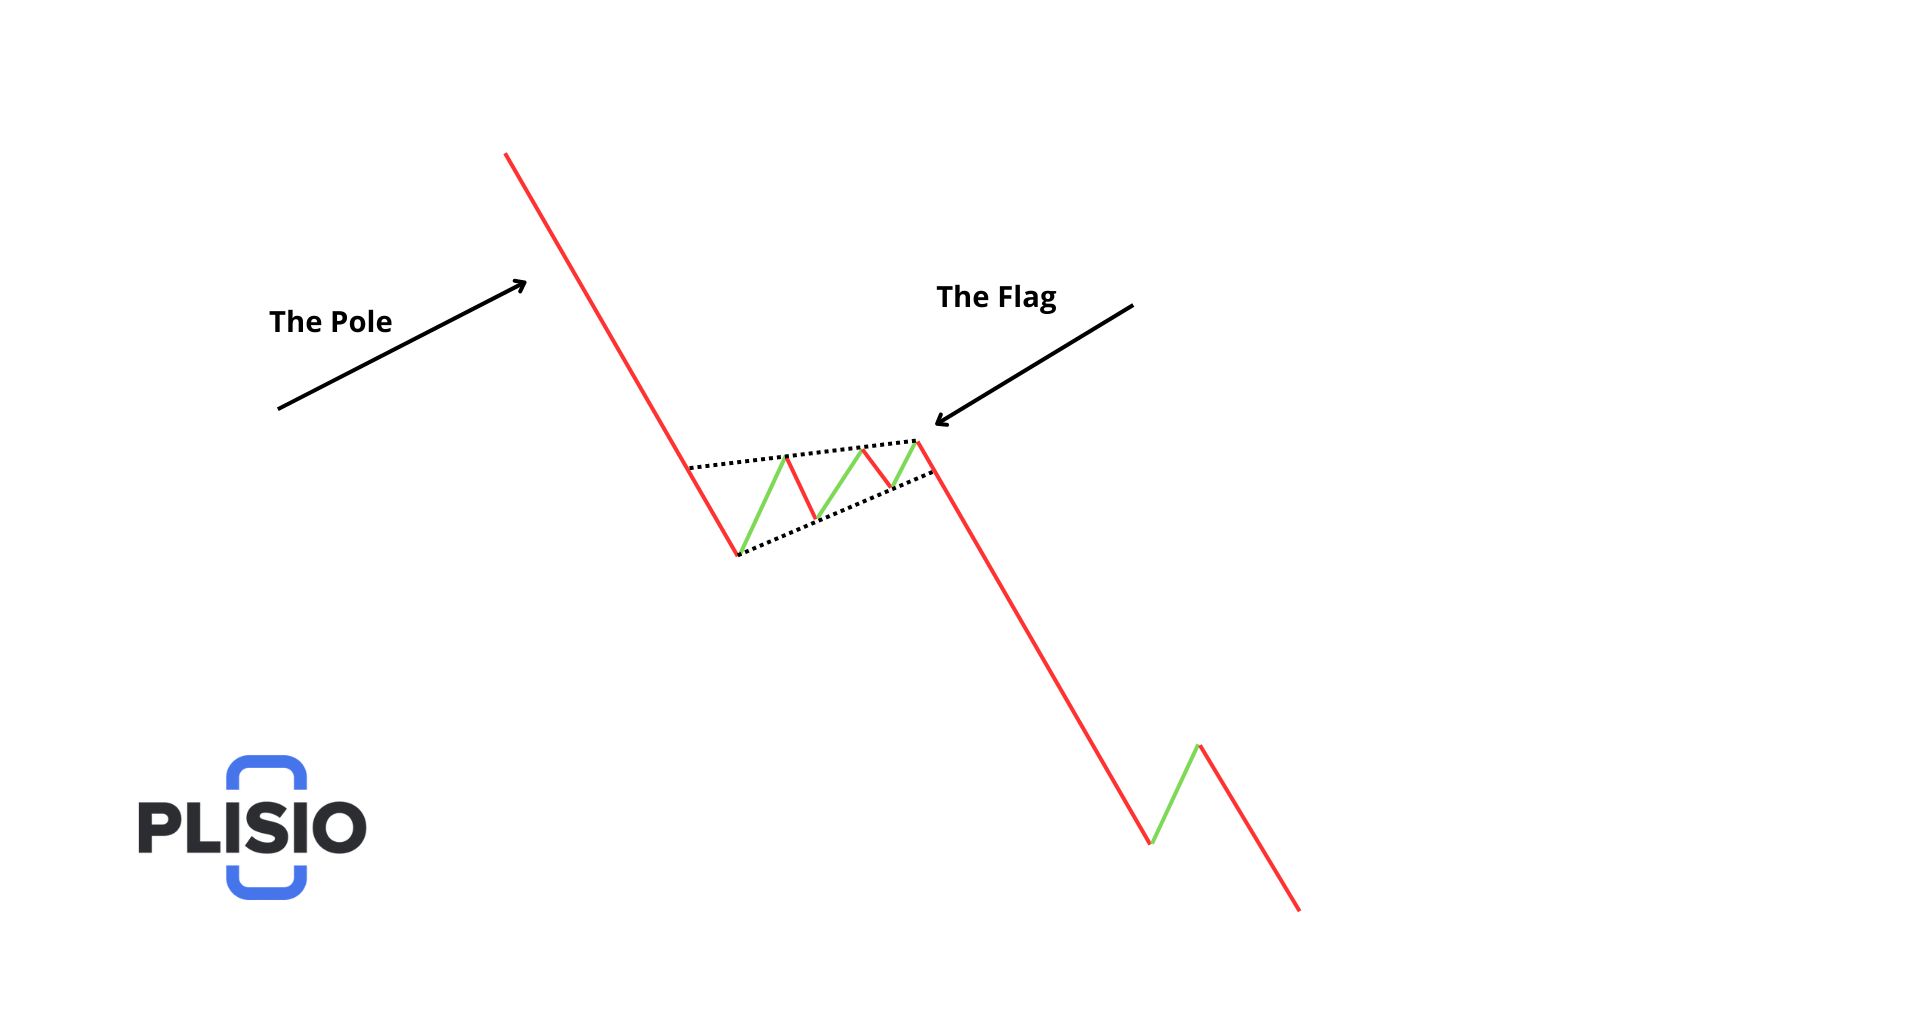
Why do traders bother with it? The structure is blunt and easy to see. A hard sell-off makes the pole. A shallow, upward-drifting range makes the flag. Price then breaks the floor of that range and carries on falling.
One thing to nail down early: this is a bearish continuation pattern. Not a reversal. It is telling you the downtrend that is already there has more to give, and it gives you a defined entry point, a sensible place for the stop, and an easy target to measure. Ahead, we get into how the pattern builds, how to confirm it, how to trade it for real, and how to catch the one that is about to fail on you.
How a Bear Flag Pattern Forms on a Chart
It starts with a shove. Price falls hard and fast, often on bad news, a support level giving way, or a broad market flush that drags everything down at once. That drop is the flagpole. Its length matters later, so note where it begins and where it ends.
Then the selling cools off. Bargain hunters show up, convinced the worst is over, and their buying lifts price back up inside a narrow range. Draw a line across the minor highs and another across the minor lows and you get two roughly parallel rails tilting gently against the trend. That is the flag formation. Think of it as the market resting, not turning.
The crowd underneath it is still bearish, though. Early sellers bank profits, dip buyers provide a little demand, and for a few candles things look calm. The calm does not last. Buyers run out of conviction, supply takes over, and price cuts down through the lower rail of the flag to continue the move it was already making.
Key Features That Define a Valid Bear Flag
A sideways wobble after a drop is not automatically a setup. A clean bear flag ticks a specific set of boxes, and every box you skip makes a false signal more likely.
- A downtrend already in place. Lower highs, lower lows, price under its key averages before the flag shows up.
- A steep pole on heavy volume. The initial decline is close to vertical, with an obvious jump in trade volume behind it.
- A tight channel. Two near-parallel trendlines, sloping up or running flat against the direction of the trend.
- A shallow pullback. The bounce inside the flag normally gives back less than half the flagpole's height. Deeper than that and the pattern weakens.
- Volume drying up. Activity fades while the flag builds, then jumps again on the break lower.
- A short life. On a daily chart the flag tends to resolve inside one to three weeks. Intraday, it can be over in an hour.
Get all of those together and you are looking at a textbook bearish flag pattern worth trading.
How to Identify a Bear Flag Pattern Step by Step
Finding the setup live is mostly a process of ruling things out. Run these checks in order.
- Confirm the downtrend. Price should sit below its main moving averages and be carving lower lows. No bearish trend, no flag. Stop here.
- Mark the flagpole. Find the sharp, high-volume slide that leads into the pause. Note its top and bottom.
- Draw the flag. One trendline across the small highs, one across the small lows. Roughly parallel, angled slightly upward.
- Read the volume. It should have spiked on the pole and be shrinking now as the channel develops.
- Wait for the break. Keep your eyes on the lower trendline. A candle that closes clearly below it, ideally with volume picking up, finishes the pattern and points to bearish continuation.
Step five is where discipline pays off. Plenty of traders fire early while price is still inside the channel, then get shaken out on the last wick before the real move starts.
Confirming a Bear Flag With Volume and RSI
The shape on its own will lie to you sometimes. Confirmation tools weed out the flags that look right but have nothing behind them.
Volume does most of the work. A bear flag you can trust runs heavy volume on the pole, a visible dip in trade volume through the consolidation, then a fresh surge as price breaks the lower boundary. If volume holds steady or climbs while the flag forms, the buyers may have more strength than the pattern is letting on.
RSI adds a second read. It is a momentum gauge scaled from 0 to 100, and in a healthy bearish flag it hangs below 50, then rolls over out of the 40 to 50 band as the flag matures. Watch for bullish divergence, where price prints a lower low but RSI prints a higher low. That gap is a hint the downtrend is tiring.
Two more checks, quickly. The 50-period moving average often caps the top of the flag and acts as dynamic resistance, which keeps the trend honest. MACD staying under its zero line while the flag builds is one more quiet vote for the move continuing. None of this makes the trade a sure thing. Stack a few in your favor and the odds tilt your way.
How to Trade a Bear Flag Pattern: Entry, Stop, Target
With the pattern confirmed, the trade runs on a plan you can repeat. This is the point where bear flag trading stops being chart reading and starts being risk management.
- Pick your entry. Aggressive: short the moment a candle closes below the lower trendline. Conservative: wait for price to climb back to that broken line, fail there, and then short. The second option skips a lot of false breakouts but costs you a slightly worse fill.
- Set the stop. Just above the upper trendline, or above the last swing high inside the flag. A small cushion sized off the Average True Range keeps normal noise from stopping you out.
- Measure the target. Take the height of the flagpole and drop that same distance below your breakout point. That measured move is your main objective.
- Bank some at support. If a well-worn support level sits between entry and target, take partial profit there and trail the rest lower.
- Do the risk-to-reward math. A clean bear flag usually pays somewhere around 1:2 to 1:3. If a given setup does not, pass on it.
Over a run of trades, the stop is the thing that keeps you in the game. The measured move is a target, nothing more. Scale out on the way down so the breakdowns that fizzle early do not eat the profit from the ones that ran.
Bear Flag vs Bull Flag: Spotting the Difference
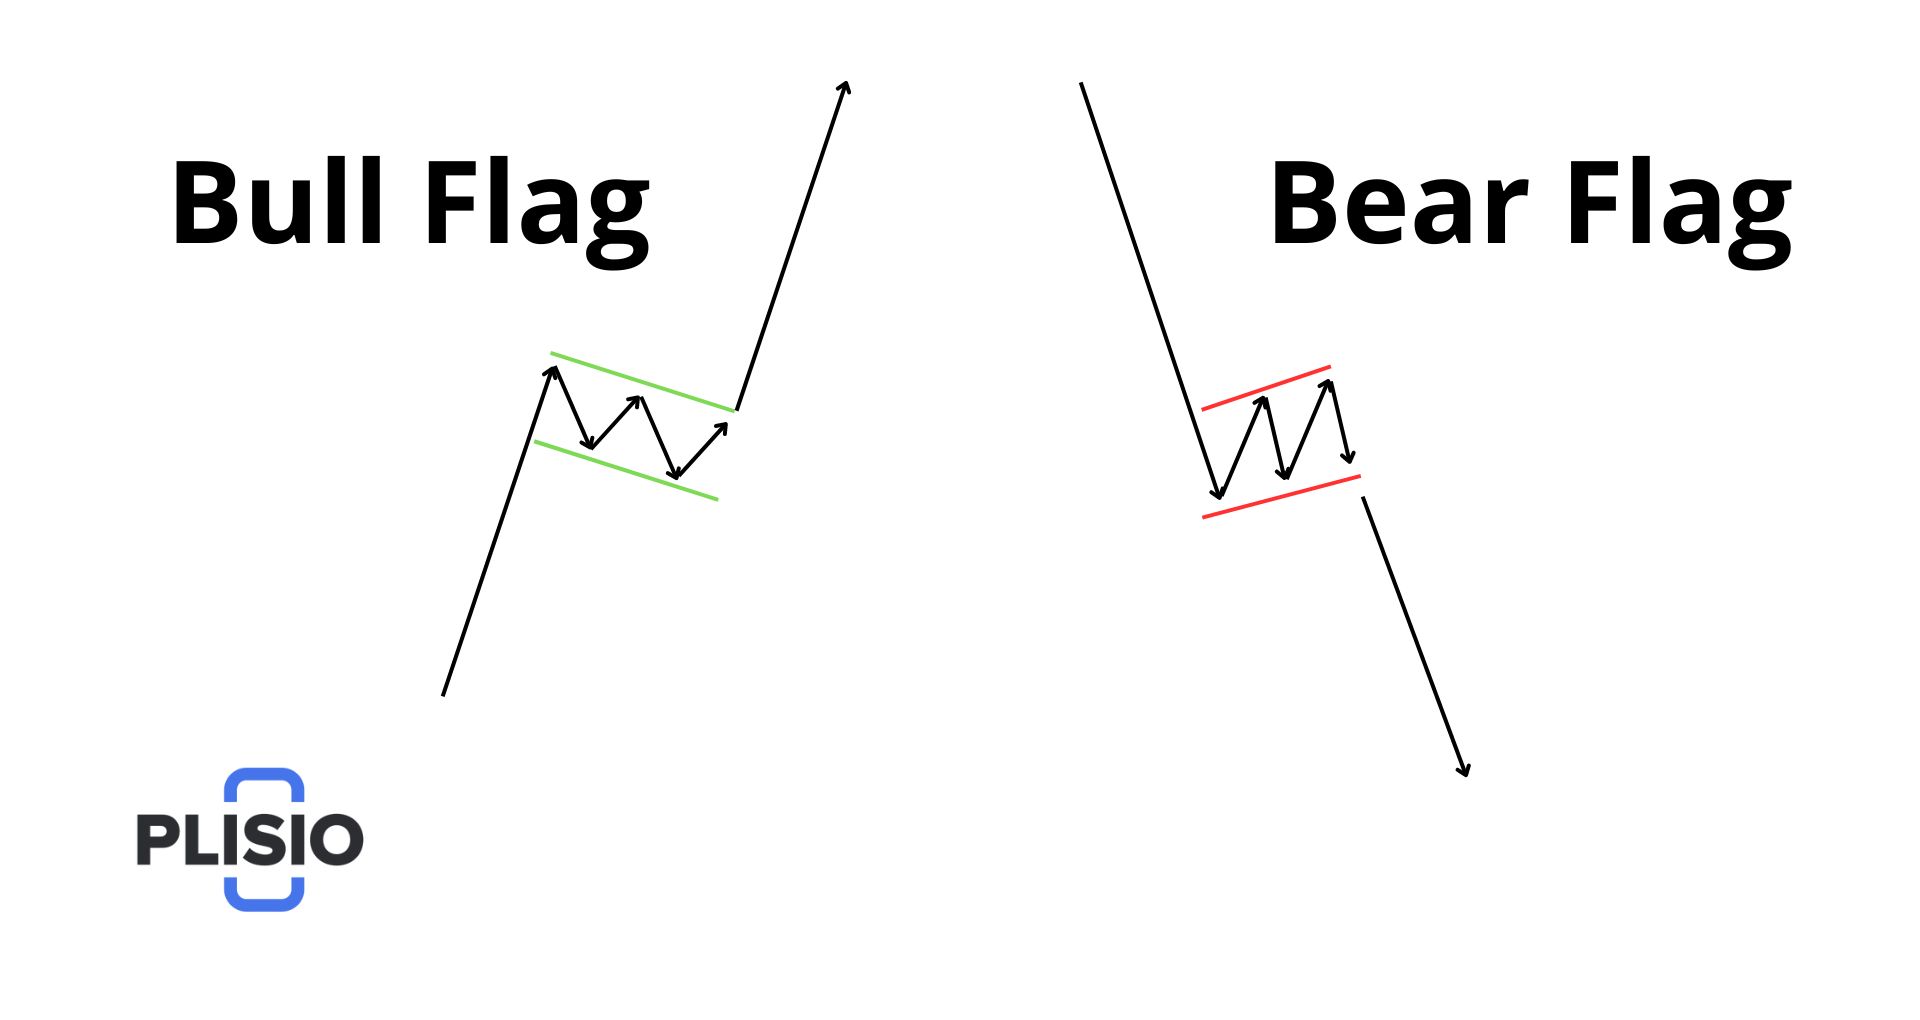
A bull flag is just this pattern turned on its head. You get the same parts, a pole and then a consolidation and then a break that goes with the trend. Direction flips, and so does what it is telling you.
| Feature | Bull flag | Bear flag |
|---|---|---|
| Prior trend | Uptrend | Downtrend |
| Flagpole direction | Sharp rally up | Sharp sell-off down |
| Flag slope | Drifts slightly down | Drifts slightly up |
| Breakout direction | Upward, through the upper trendline | Downward, through the lower trendline |
| What it signals | Continuation of the rise | Bearish continuation of the fall |
Learn one and you have basically learned both. Reverse the direction, swap where the stop and target go, and you run the same playbook.
Bear Flag vs Bear Pennant in Technical Analysis
The bear flag and the bear pennant are close relatives. Both come after a steep drop, both say the downtrend should keep going, and both use the same measured-move target. The consolidation shape is the tell.
| Feature | Bear flag | Bear pennant |
|---|---|---|
| Consolidation shape | Parallel channel, slight upward tilt | Converging triangle, symmetrical narrowing |
| Trendlines | Roughly parallel | Contract toward a point |
| Typical duration | Short | Often even shorter and tighter |
| Volume behavior | Contracts, then expands on breakout | Contracts, then expands on breakout |
You trade them the same way regardless. A pennant pattern just means buyers and sellers have squeezed into a tighter standoff before price commits. Mark the boundaries, wait for a close outside them, measure down from the top of the pole.
When a Bear Flag Pattern Fails
A failed bear flag is when price breaks out of the top of the channel instead of the bottom. No bearish continuation. The market turns up, and anyone who shorted early is now on the wrong side.
A few things usually tip you off before it happens:
- A support level nearby keeps holding, and price bounces off it again and again.
- Volume refuses to contract inside the flag, or it actually grows.
- RSI diverges bullishly against price.
- The wider market, or a coin that usually leads, turns higher while your flag is still forming.
What to do about it is not complicated. Already short and price closes back above the upper trendline? Take the stop and get out. Do not flip long just because the flag failed. Wait for a clean setup in the other direction, with its own confirmation, before you trade it.
Pros and Cons of Trading the Bear Flag Pattern
Every tool in technical analysis has a good side and a catch. The bear flag is no different.
Pros:
- A clear structure that gives you an entry point, a stop, and a measured target without guesswork.
- It travels well: forex, stocks, commodities, crypto, and most timeframes.
- It shows up often, so you are not waiting weeks for one.
- The risk-to-reward is usually in your favor when the setup is clean.
Cons:
- Where exactly you draw the flag is a judgment call, and two traders will not always agree.
- In choppy, trendless markets it fails a lot.
- Without volume and momentum backing it, false breakouts are common.
- It only works the short side, so buy-and-hold investors get little out of it.
Common Mistakes When Trading Flag Patterns
Most losing bear flag trades trace back to a short list of errors. Keep an eye out for these.
- Calling a sideways range a flag when there was never a real pole or a trend before it.
- Dropping to tiny timeframes where the "pattern" is just noise.
- Waving through any flag-shaped squiggle without checking volume.
- Shorting before the breakout candle has actually closed below the flag.
- Tucking the stop inside the flag, where ordinary chop takes it out.
- Fighting the higher-timeframe trend, or walking straight into a scheduled news release.
Solid trading strategies use the bear flag as one signal among several, not as a button that says buy or sell.
From Chart Patterns to Accepting Crypto Payments
Reading a chart pattern is a trader's skill. Getting paid in crypto for a business is a different problem with different tools. If you sell something and want to accept digital assets without babysitting wallets or eating the volatility, Plisio handles Bitcoin, Ethereum, USDT, and dozens of other coins, with automatic conversion and low fees. The market's swings stay on your trading screen, not on your books.